This tutorial will teach you how to debug xv6 remotely using CLion.
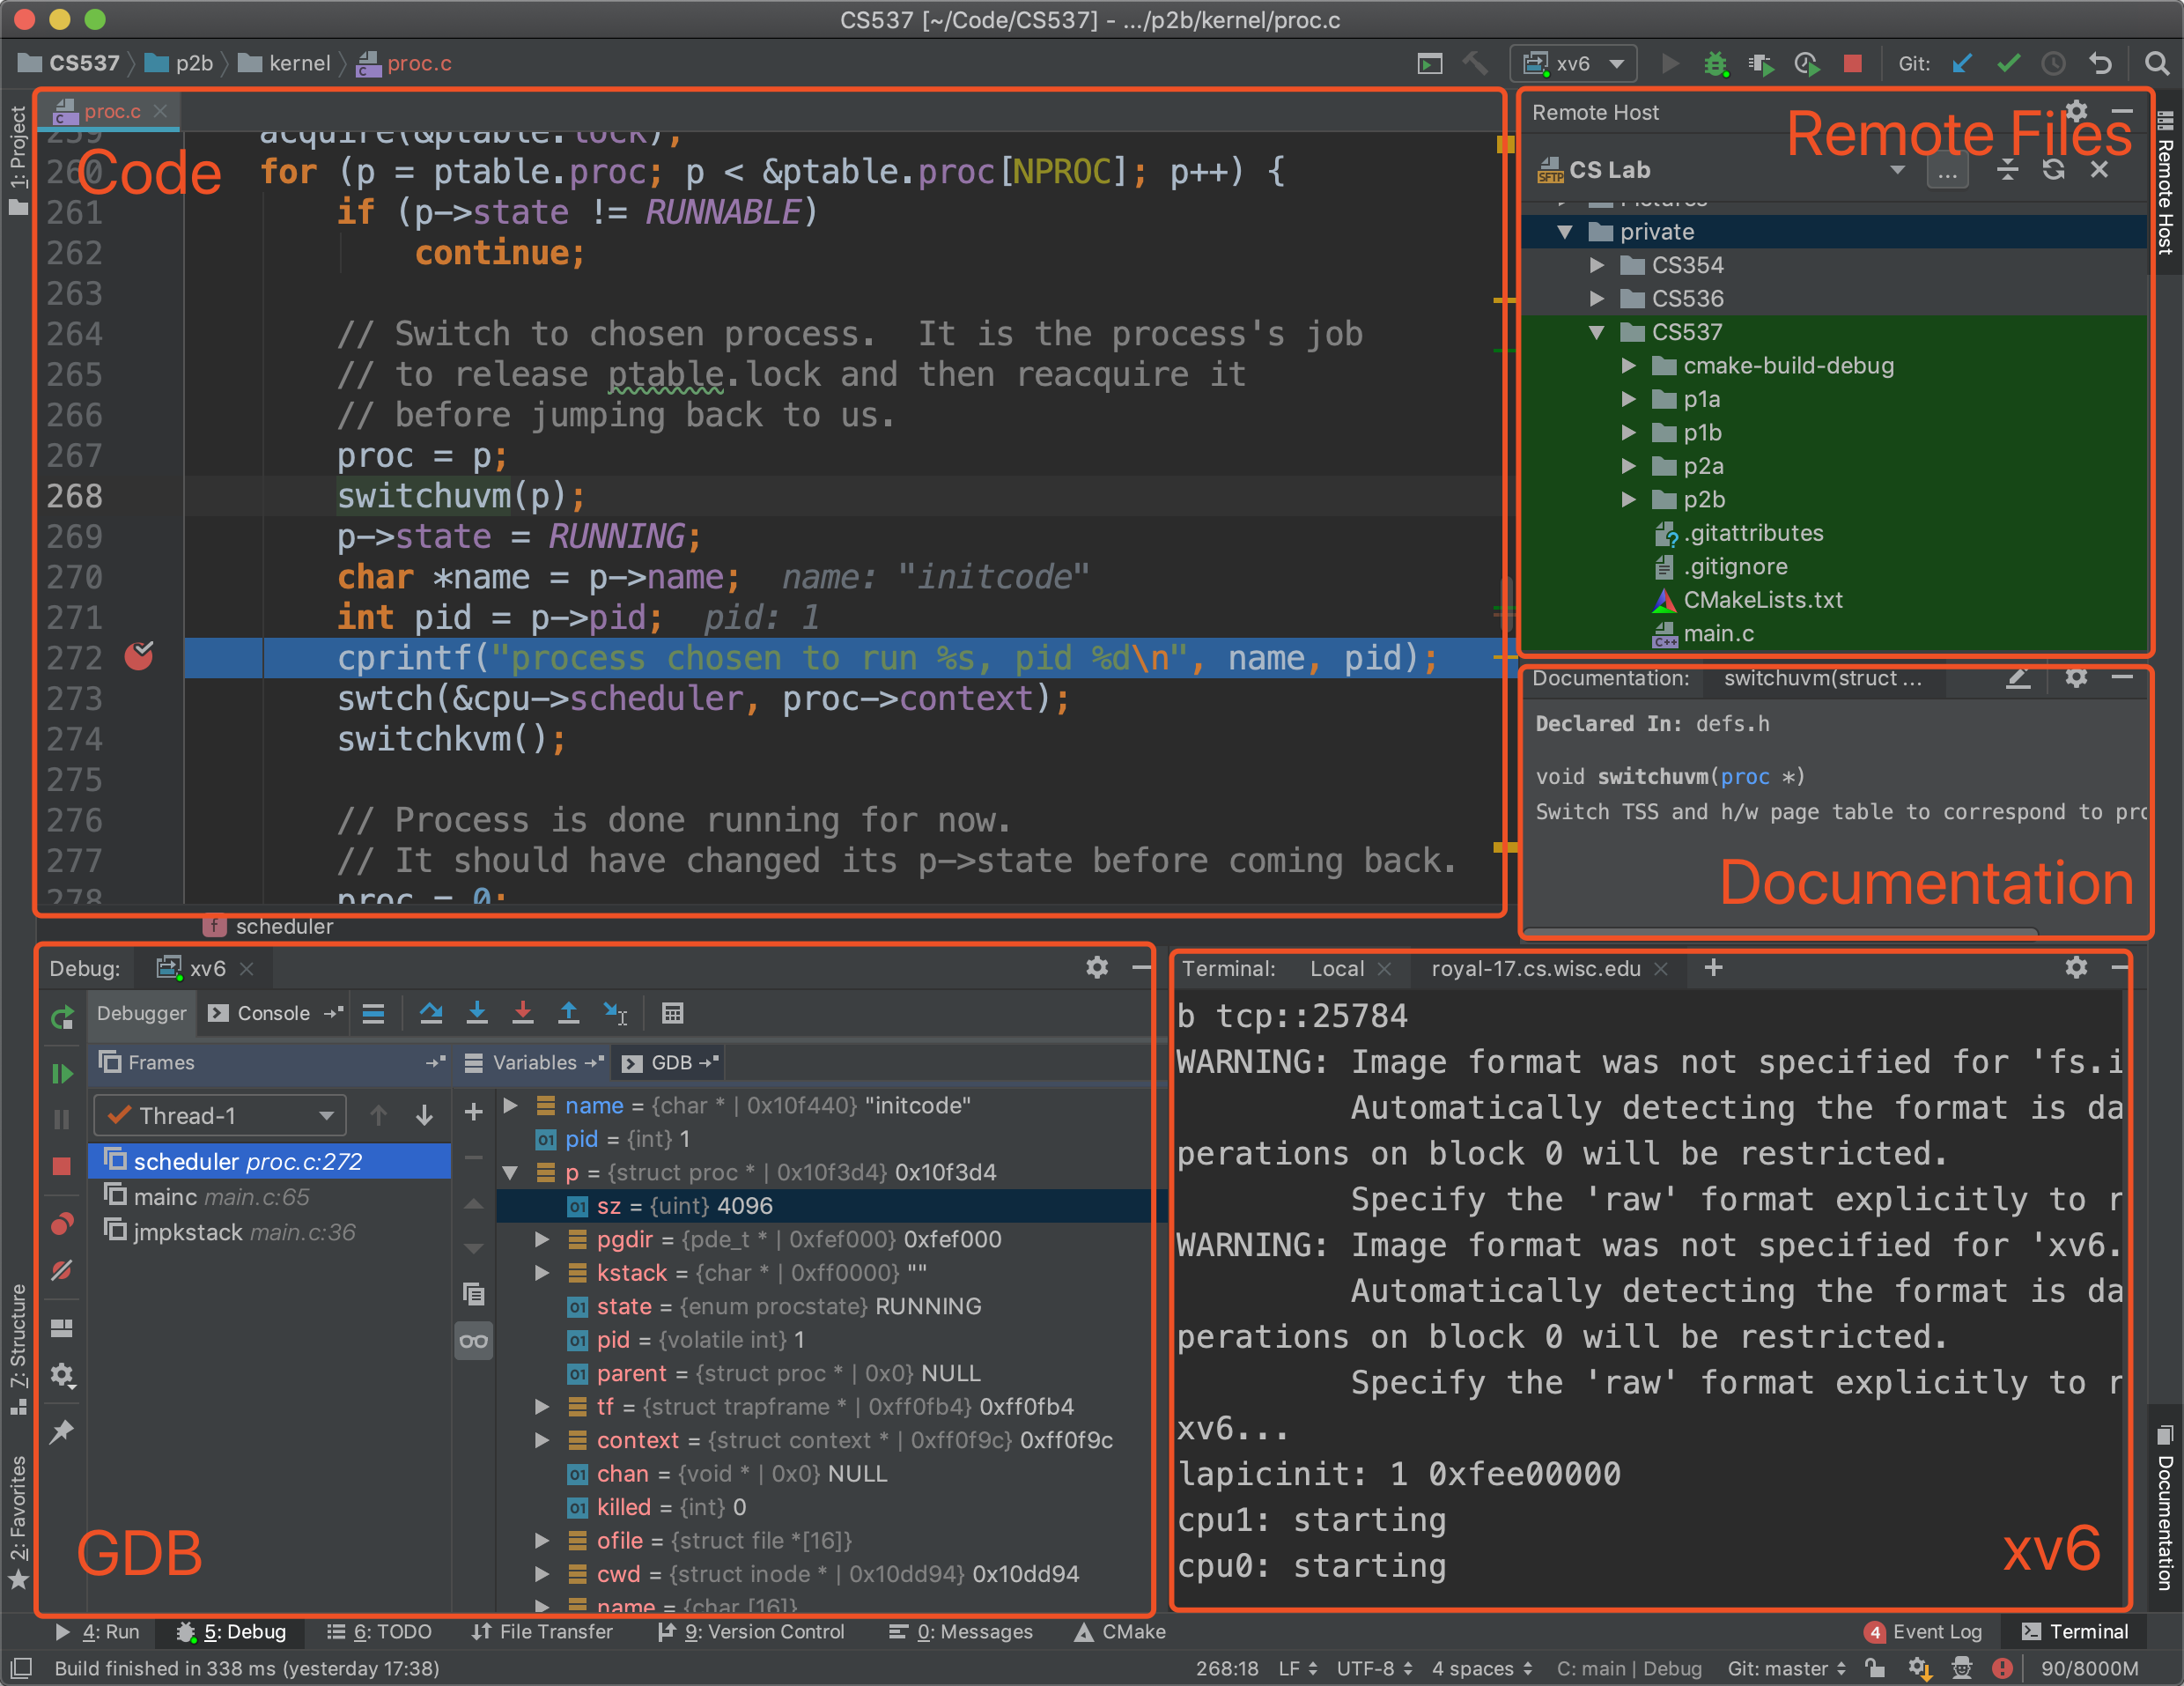
In the screenshot below, I have:
- xv6 running remotely on a CS Lab machine
- gdb connected to xv6 with frames and variables showed
- code edited on the local machine and automatically synced
- files on CS Lab machine listed
- documentation (and declared location) shown for the selected function
If you haven’t installed CLion or haven’t set up file synchronization, you can read my previous tutorial: Setting up Coding Environment for CS 537.
This tutorial is specifically focused on debugging xv6. Since xv6 is running in QEMU (instead of a host machine), we have to manually connect gdb to the gdb server, which complicates the setup process. I have another tutorial about debugging general C programs here: Remote Debug and Execution using CLion.
Prof. Shivaram has a great tutorial about using gdb to debug xv6 during the discussion section. You can find the recorded video on this piazza page. I highly recommend to watch the video first, but this tutorial doesn’t require any prior knowledge about gdb.
1. Preparation
Note: You can skip this part if you are compiling xv6 on your local computer or you are already in the CS Lab.
1. SSH to a CS Lab machine. Please use a specific server in the following list instead of best-linux.cs.wisc.edu. (best-linux.cs.wisc.edu is the Linux machine in the CS labs that currently has the fewest number of other users logged in to it. We don’t want to use this because it might change over time.)
- rockhopper-01.cs.wisc.edu through rockhopper-09.cs.wisc.edu
- royal-01.cs.wisc.edu through royal-30.cs.wisc.edu
- snares-01.cs.wisc.edu through anares-10.cs.wisc.edu
- emperor-01.cs.wisc.edu through emperor-07.cs.wisc.edu
2. Copy xv6 to your working directory on a CS Lab machine, build the source, and run xv6 in debug mode.
cp -r /p/course/cs537-shivaram/xv6-sp19 .
make
make qemu-nox-gdb
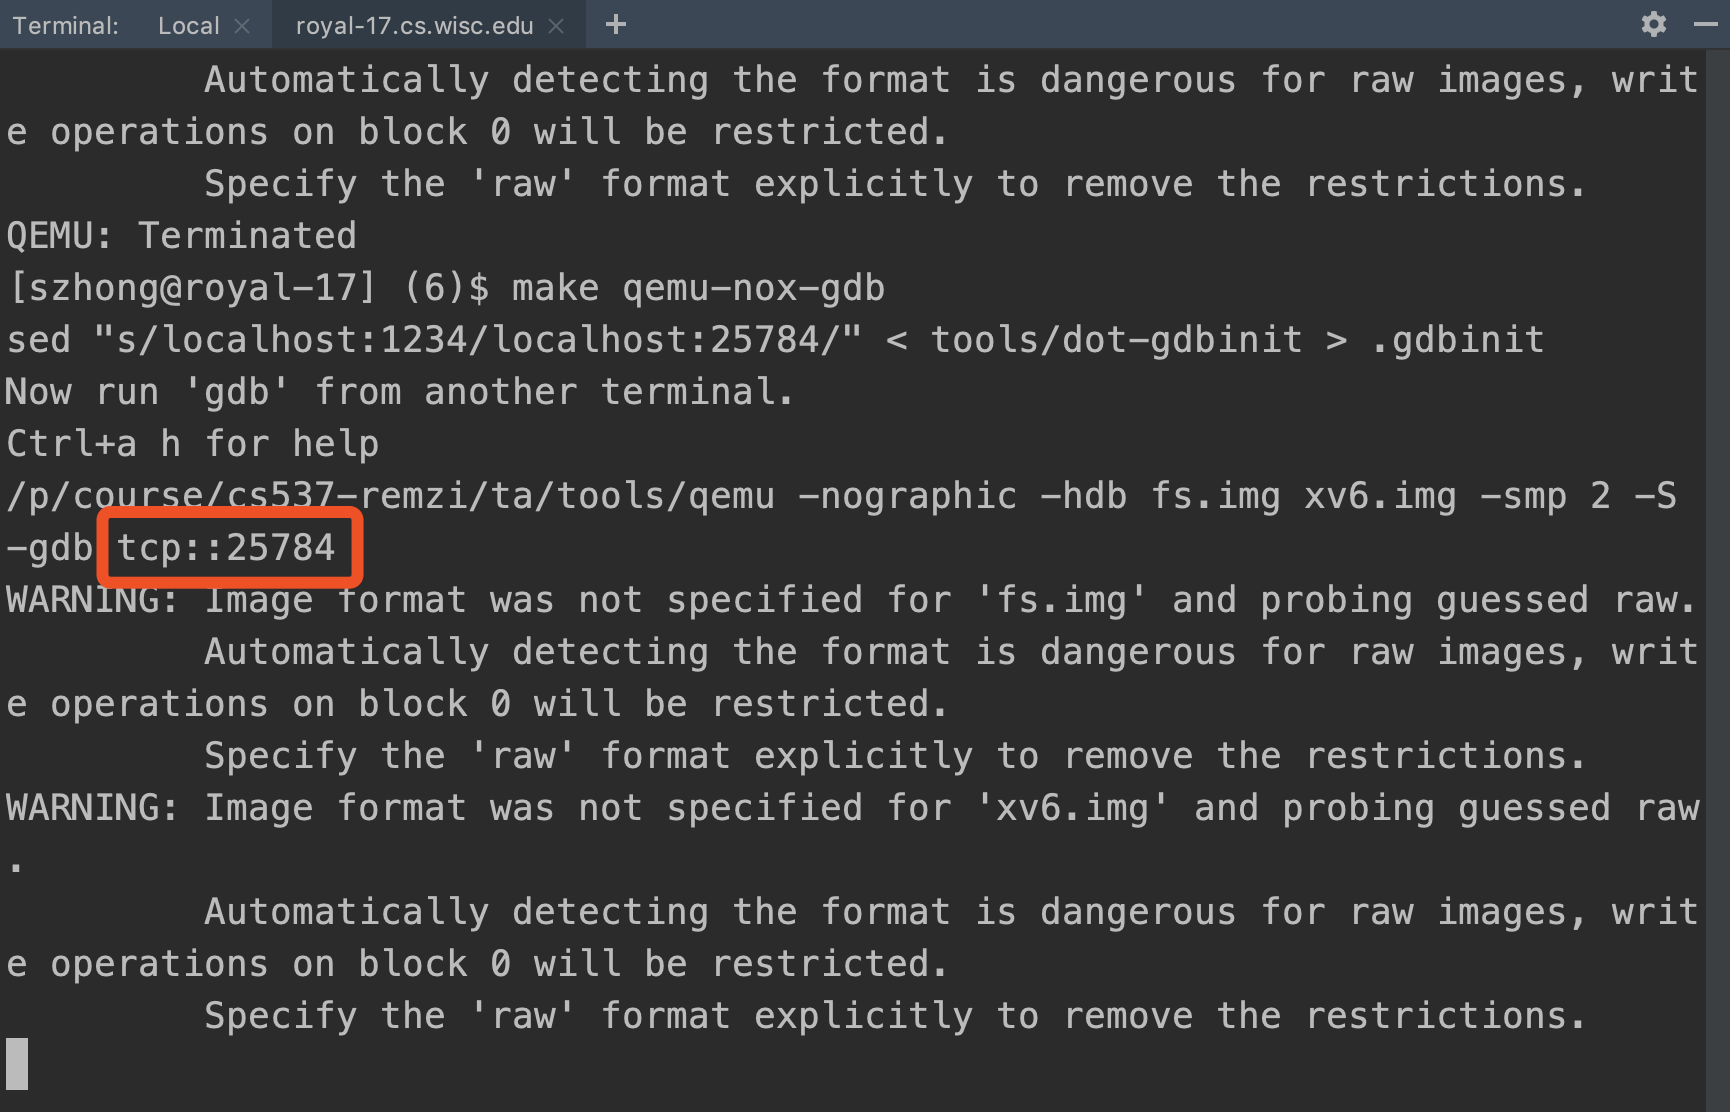
3. Record the port number for gdb server. I always have 25784, but it might be different for you. (What qemu-nox-gdb does is that it runs a gdb server at localhost:25784 so that gdb can later connect to this server to debug the code.)
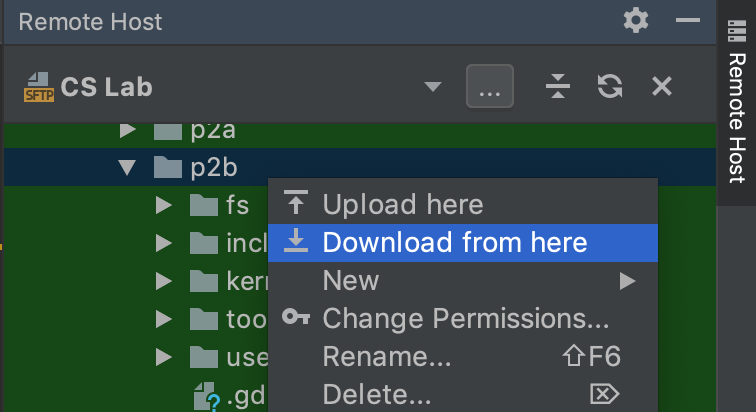
4. Open CLion and sync the folder to your local machine. Please refer to this tutorial if you don’t know how to do this.
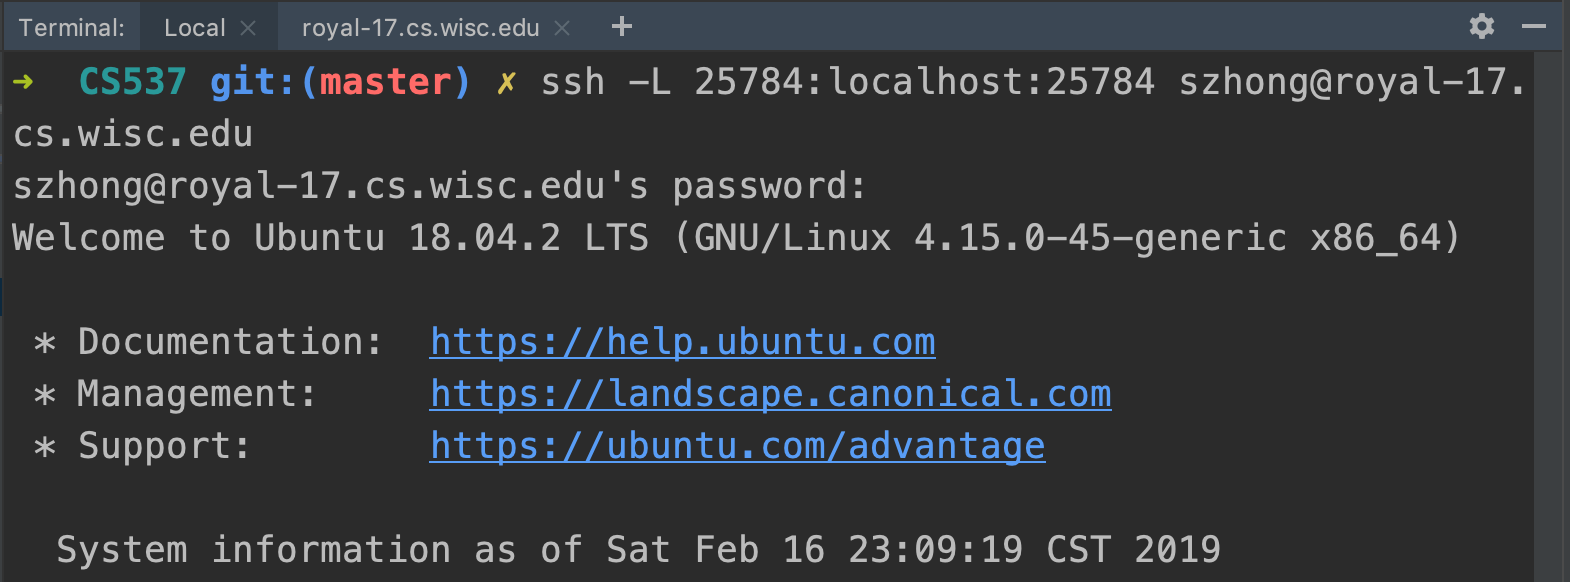
5. Open another terminal window, and use the following command to forward the port (recorded in step 2) on the remote server to your local machine. (This is called SSH tunneling or SSH port forwarding so that we can access the gdb server running on the CS Lab machine via localhost:<port> on your local machine) Note: Please leave the terminal window open at the background in the following steps.
ssh -L <port>:localhost:<port> <username>@<server>.cs.wisc.edu
2. Configure CLion
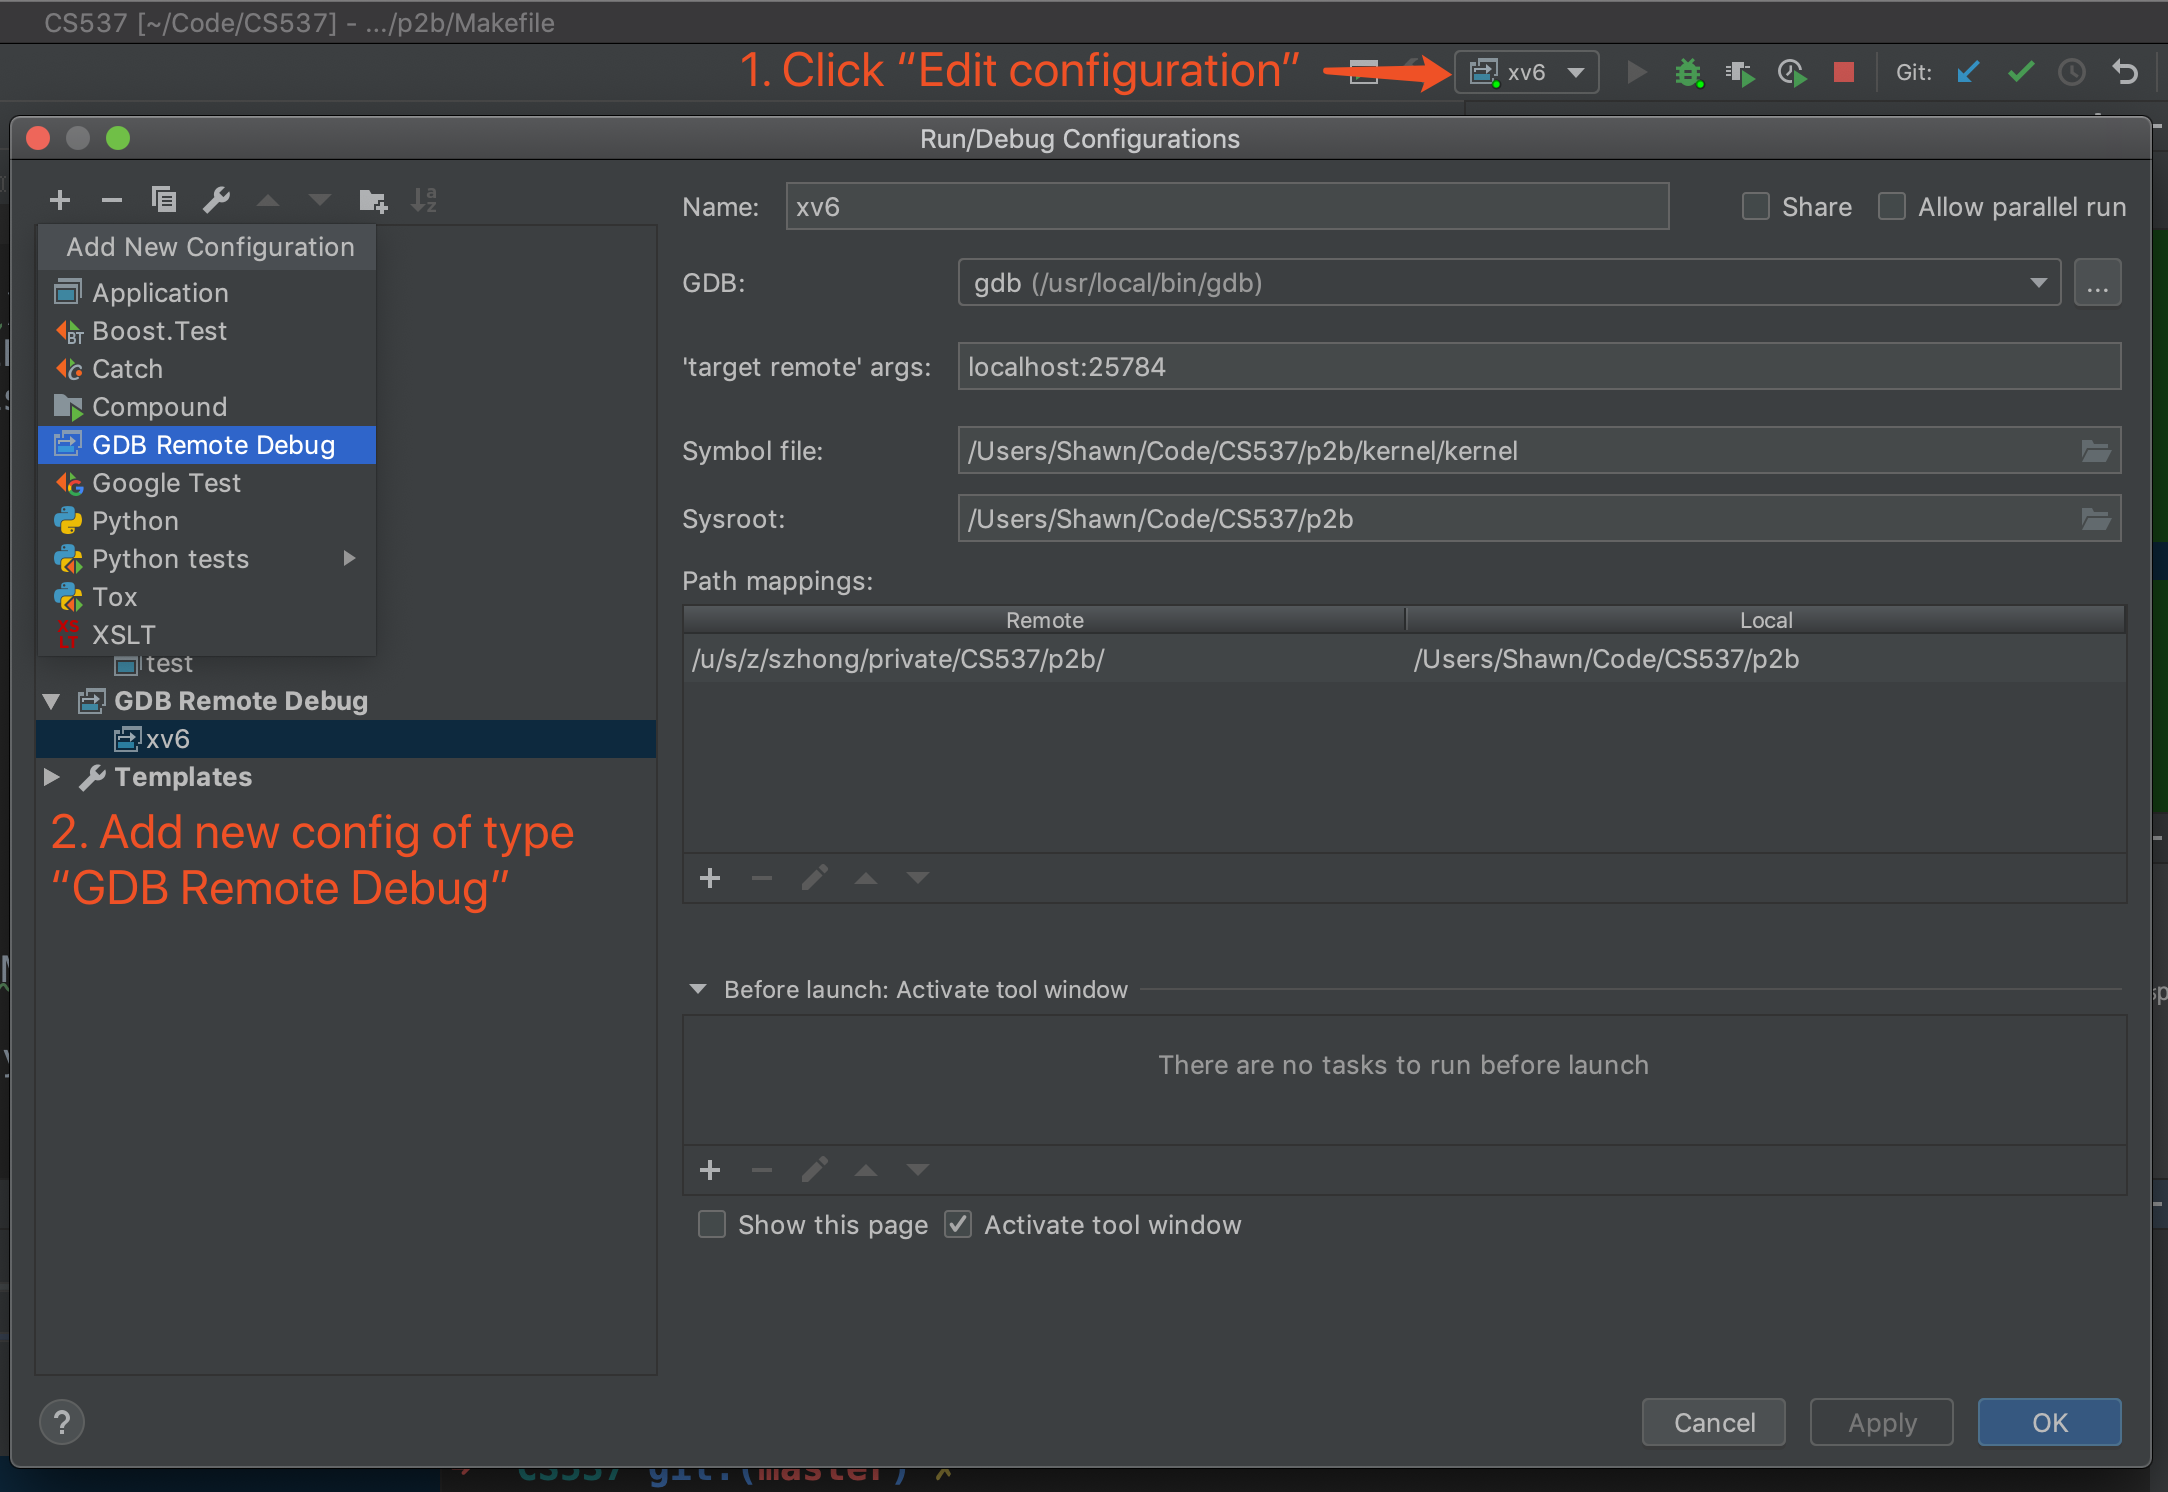
1. Click “Edit configuration” on the top-right
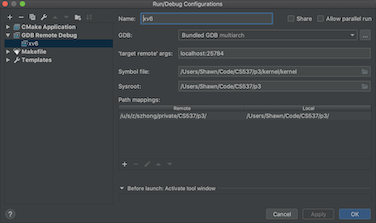
2. Add new configuration of type “GDB Remote Debug”
3. Set ‘target remote’ args to be localhost:<port>
4. Choose the symbol file to be <local_folder>/kernel/kernel. (If you cannot find this file, build xv6 again and download the built folder to your local machine)
5. Set the system root to be <local_folder>
6. Add path mappings between <local_folder> and <remote_folder>
3. Run GDB Remote Debug
For testing, let’s create a breakpoint at kernel/proc.c:261 by clicking the space next to the line number (same as “b kernel/proc.c:261” in gdb).
Click the debug button on the top-right corner. You should be able to see a debug tab open on the bottom left, which shows you the frames (same as “info frame” in gdb) and variables (same as “info variables” and “print <var_name>” in gdb).
If the debugger doesn’t stop at the breakpoint, please go to section 5: Troubleshooting.
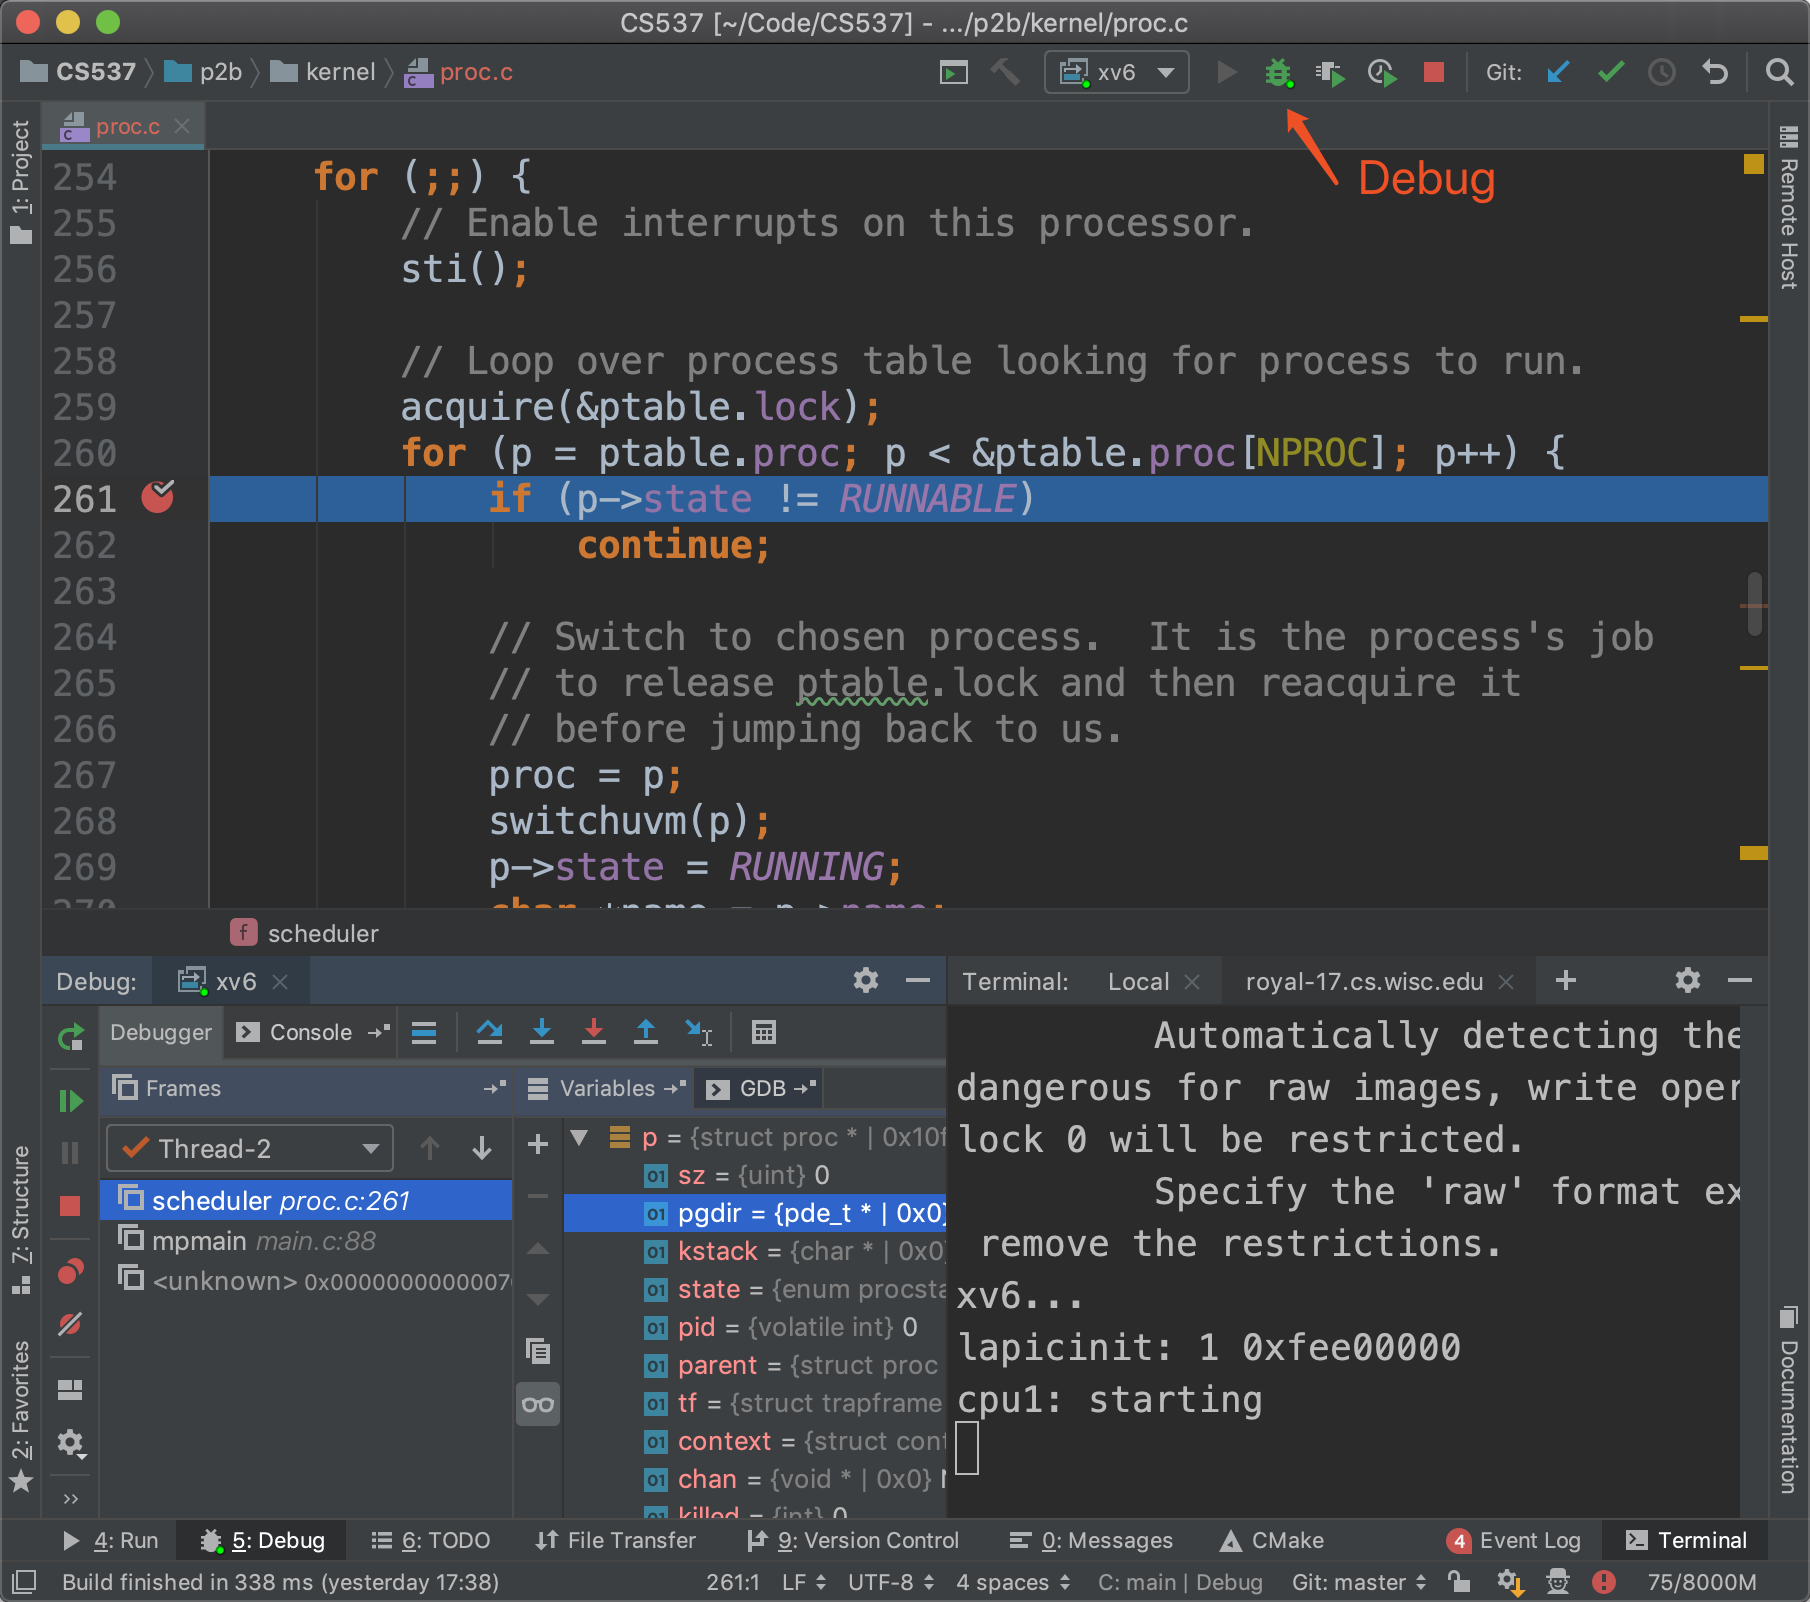
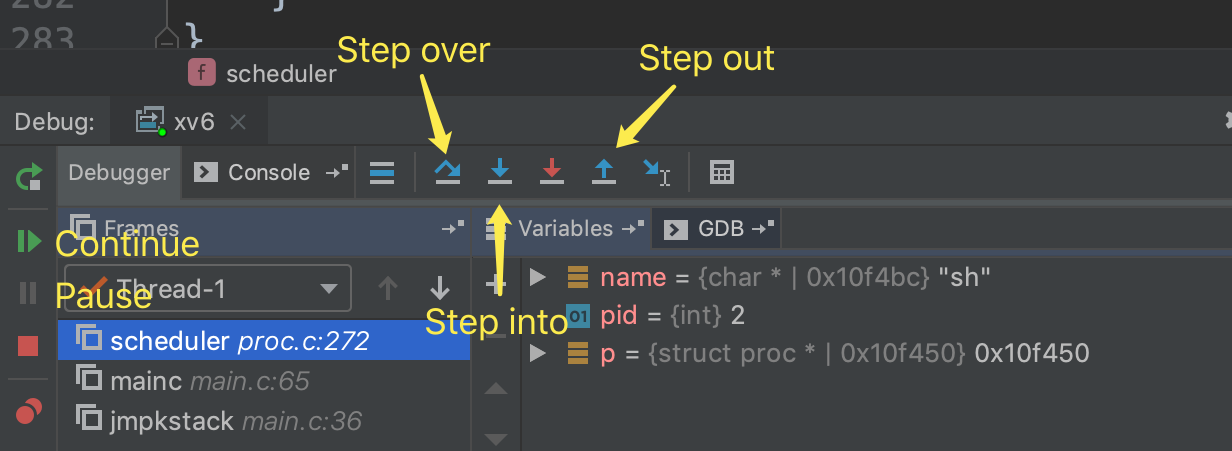
Here are some useful commands that you can use during debugging
- Step over: execute next line of code. Will not enter functions. (same as “n” in gdb)
- Step into: step to next line of code. Will step into a function. (same as “s” in gdb)
- Step out: run until current stack frame finishes (same as “finish” in gdb)
- Continue: continue running your program (same as “c” in gdb)
- Pause: pause the execution of a running program (same as Ctrl+C in gdb)
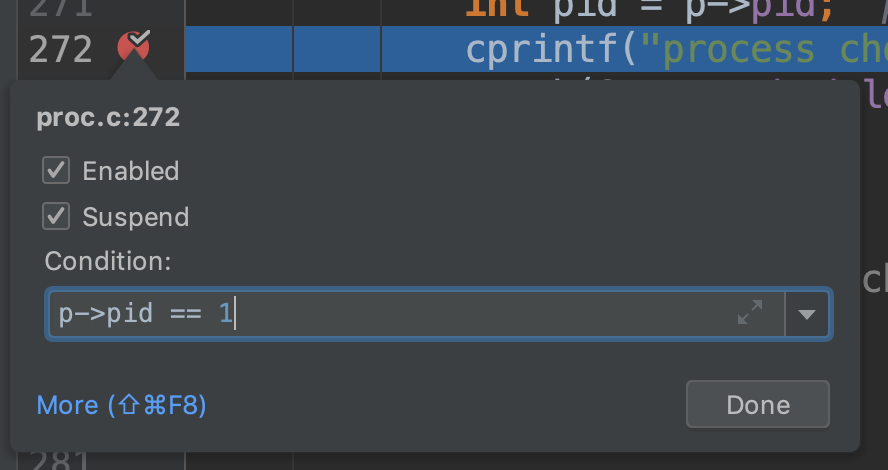
To create a conditional breakpoint, right click on a normal breakpoint to add the condition.
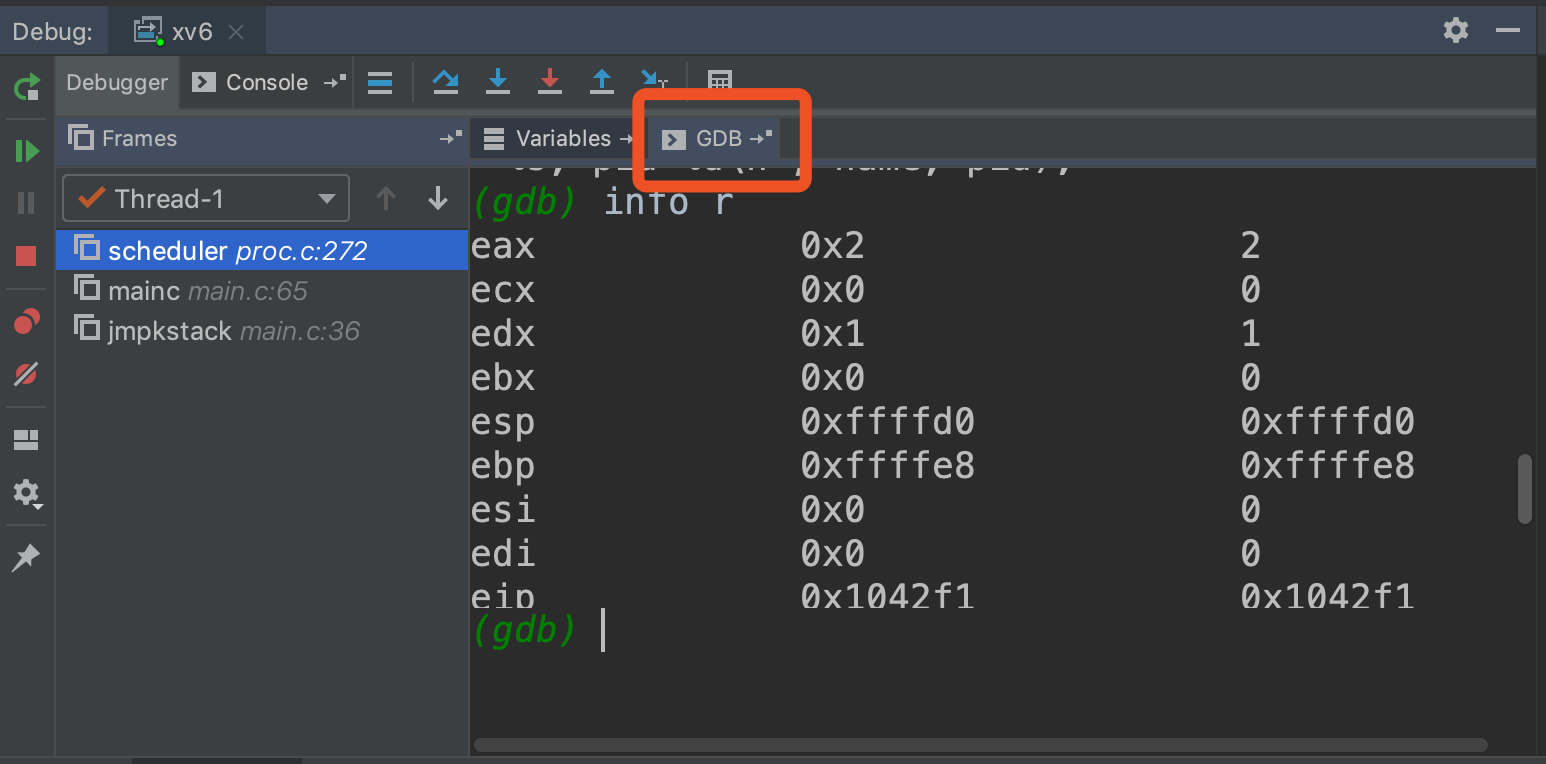
You can also directly type commands into gdb by switching to the gdb tab (when the program is paused)
4. Some Useful Tips
For better code analysis and navigation, you can mark your xv6 folder as Project Sources and Headers, and add the line “include_directories(<relative_path_to_include_folder>)” to CMakeLists.txt
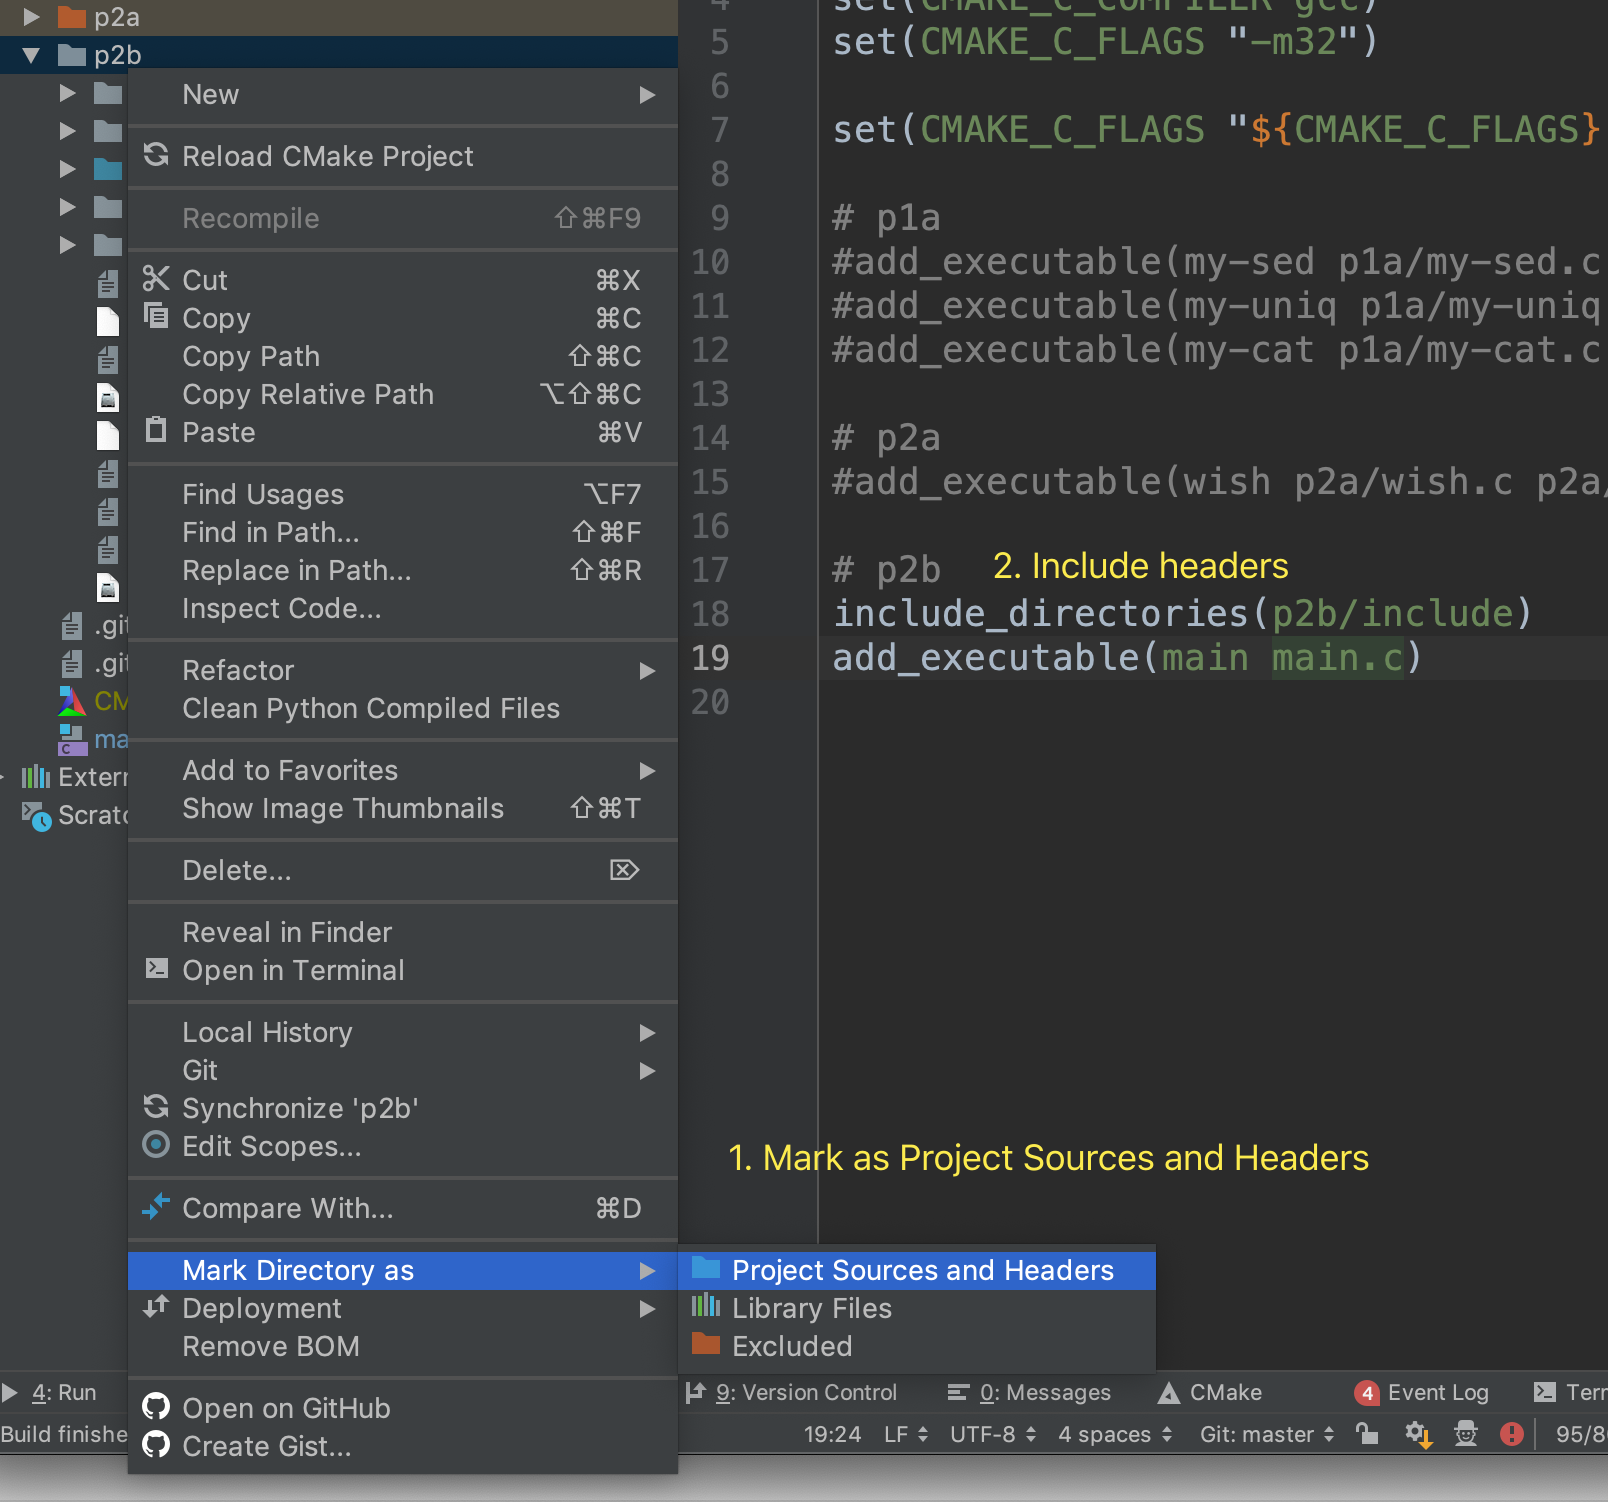
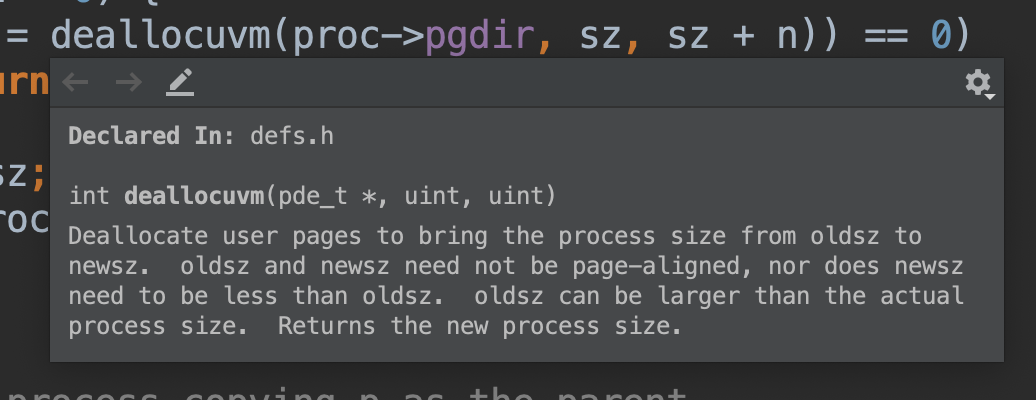
Once the previous step is done, you can press F1 on a function/variable to see the documentation. There is also an option for showing quick documentation on mouse move at “Editor – General – Other”.
5. Troubleshooting
First, make sure that the debugger is connected to the remote server. In the debug tab, you should see something like “Debugger connected to localhost:25784”.
If the message doesn’t show up, you need to check whether
- xv6 is running in debug mode (
make qemu-nox-gdb) - SSH tunnel is connected to the same server as xv6 and forwarding the right port number (
ssh -L <port>:localhost:<port> <username>@<server>)
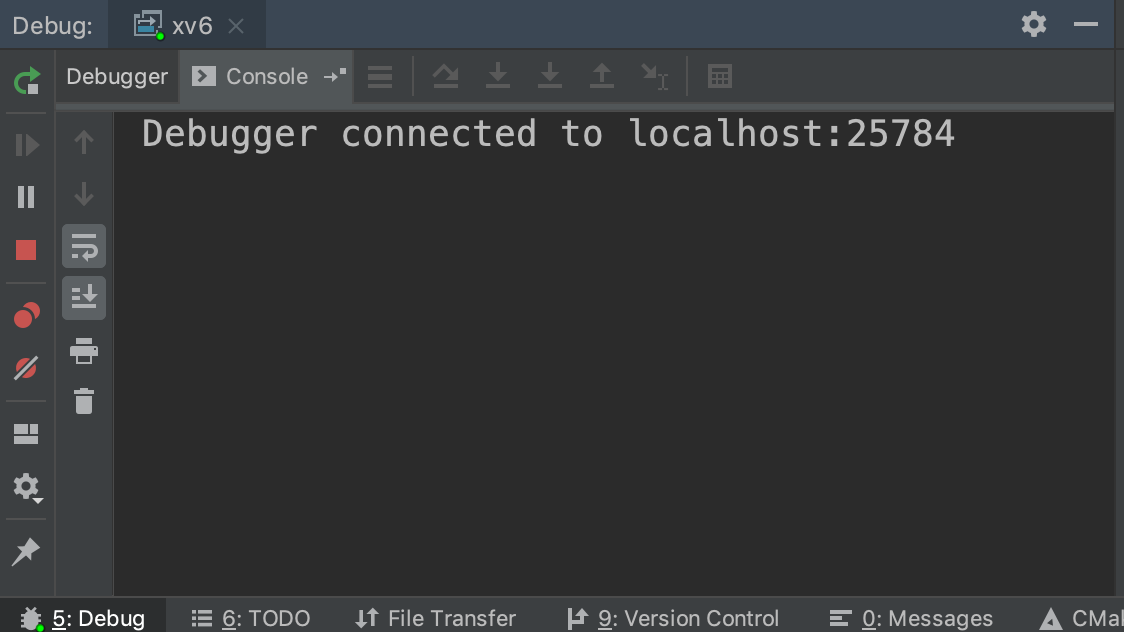
If the debugger is successfully connected to xv6, but it still doesn’t stop at the breakpoints, click the pause button at the left.
If the debugger highlighted some code in the xv6 source folder, but the line number is wired, downloading the compiled xv6 from CS Lab server again should resolve this problem. This is because the symbol table on your local computer is not up to date after you modified the code and recompiled it on the remote server.
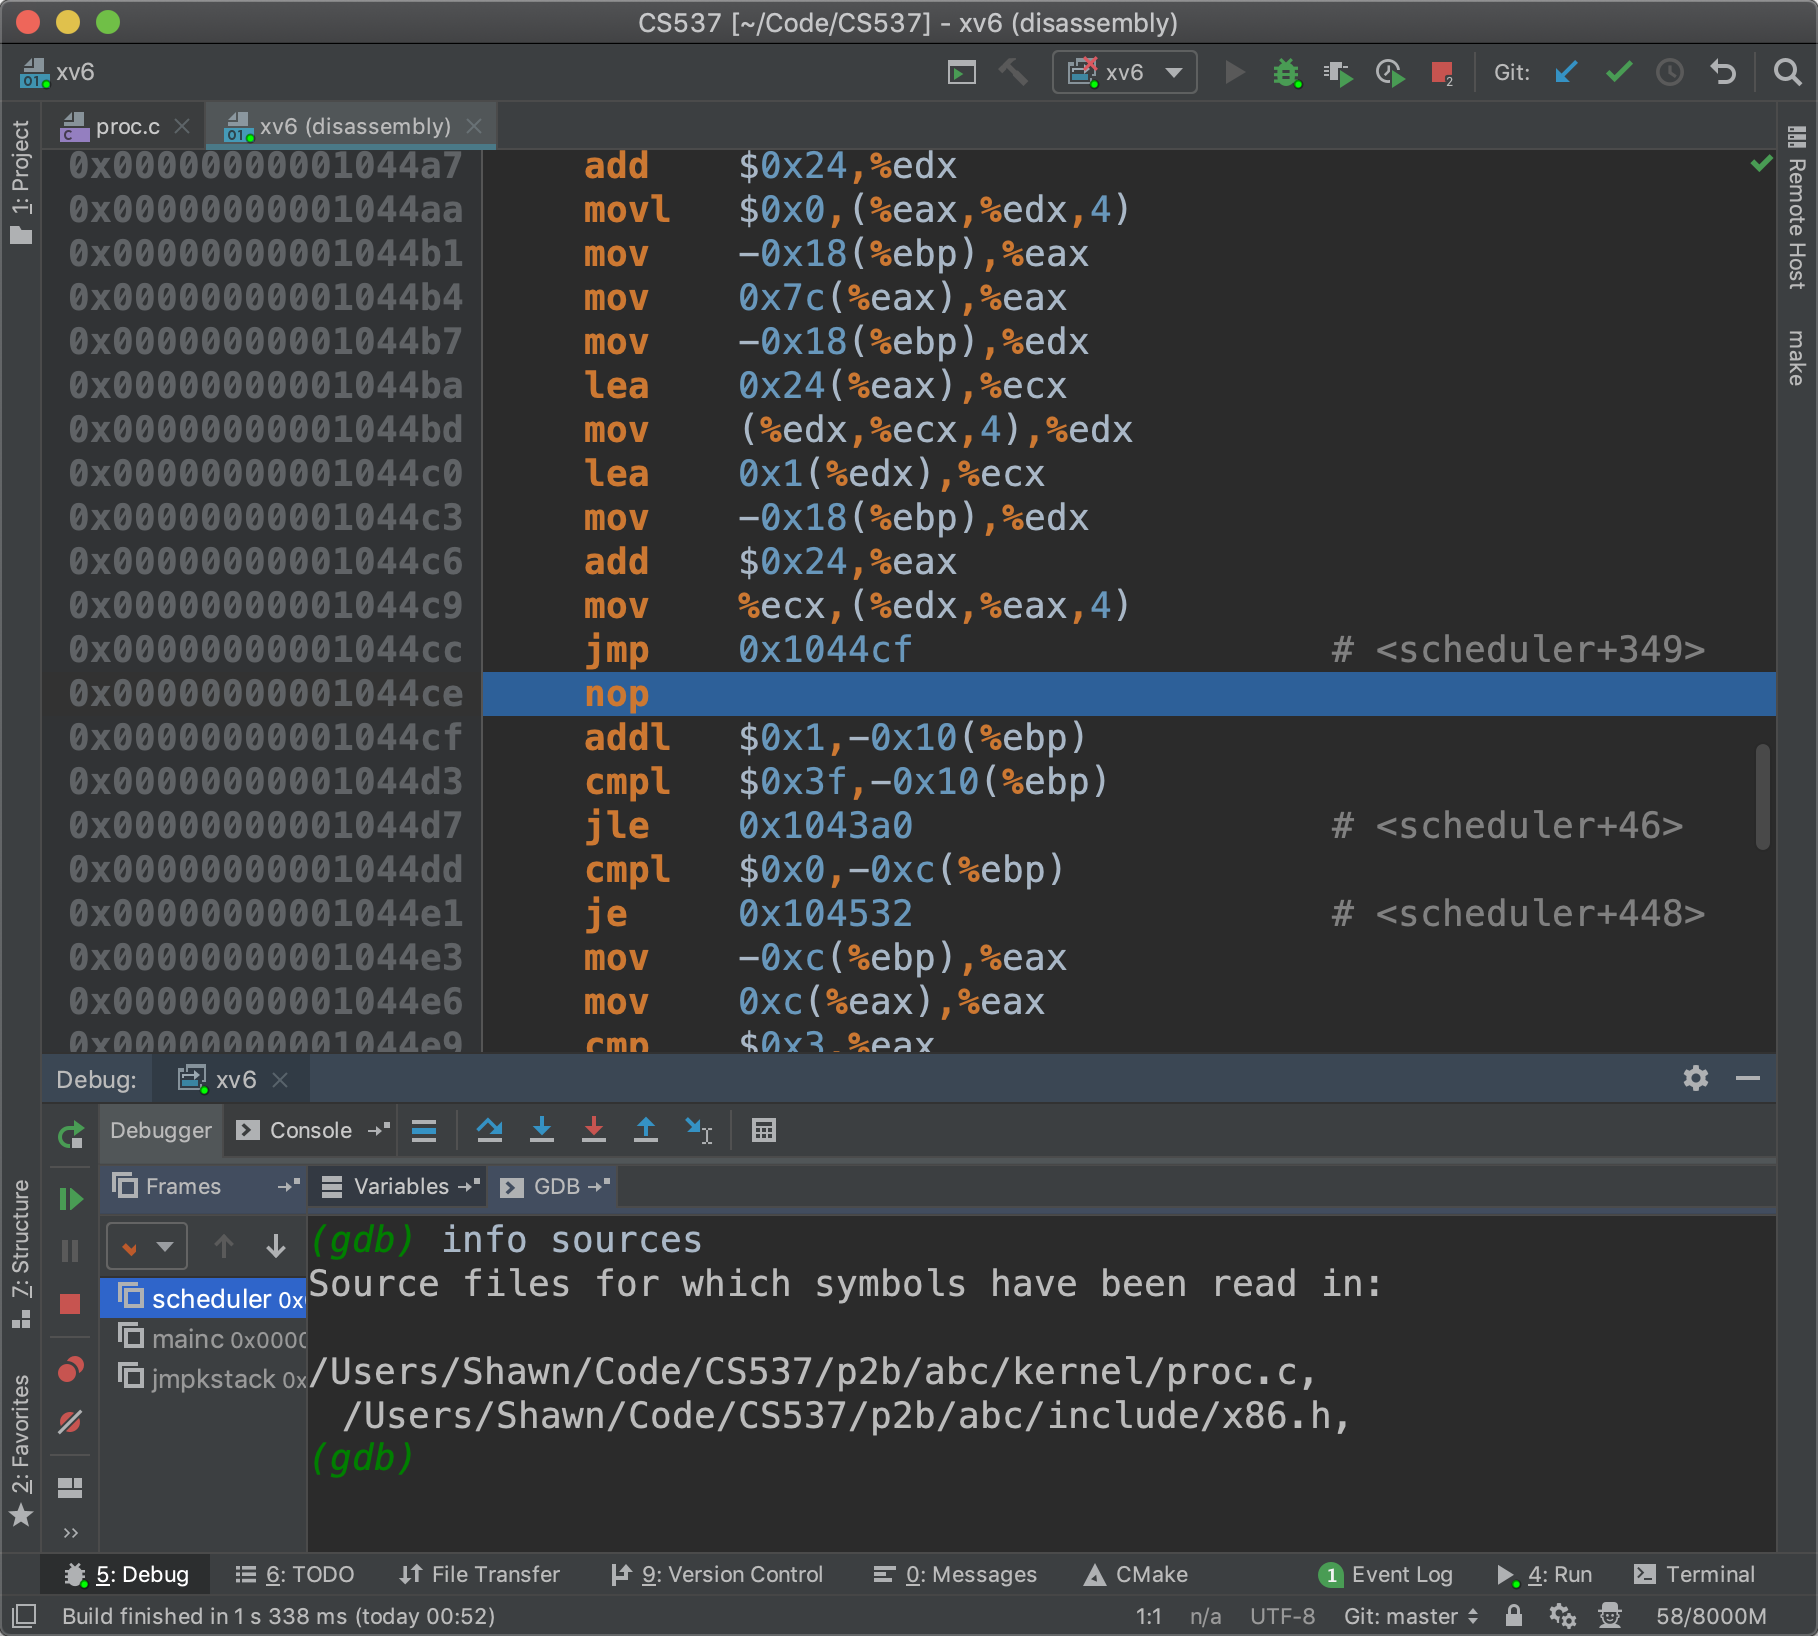
If you got an xv6 (disassembly) window with commented assembly code, switch to the GDB tab and enter info sources. Make sure that the files can be found on your local computer. If you moved the xv6 source folder after compilation, try make clean and compile again.
If the debugger is still not working, feel free to contact me by email 🙂
6. Reference
http://man7.org/linux/man-pages/man1/gdbserver.1.html
https://sourceware.org/gdb/onlinedocs/gdb/Server.html

4 comments to “xv6 Remote Debug using CLion”
You can leave a reply or Trackback this post.
Caren Lai - May 9, 2019 at 7:29 am
It looks awesome.
Zhuolun Li - September 18, 2019 at 2:24 pm
This is so helpful! Thanks a lot!
Ling Chen - September 18, 2020 at 5:23 am
REALLY helpful, thanks a lot!
However there is still a problem in the tutorial.
My computer runs 5.8.6-1-MANJARO, following your instruction I came up with error as below:
“`
Truncated register 37 in remote ‘g’ packet
“`
I did not figure out why but I guess that’s the problem of gdb version.
So I eventually switched the config from default gdb to riscv64-linux-gnu-gdb, and it did work on my computer.
I do persuade updating *step2: configure CLion*.
Ling Chen - September 18, 2020 at 5:24 am
oops…looks like comments doesn’t support Markdown