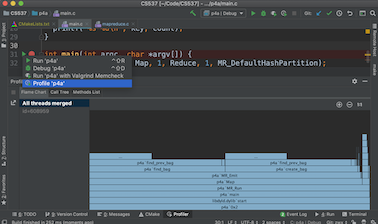
CLion has CPU profiler integrated so that you can analyze the execution time for each function and use the information for code optimization.
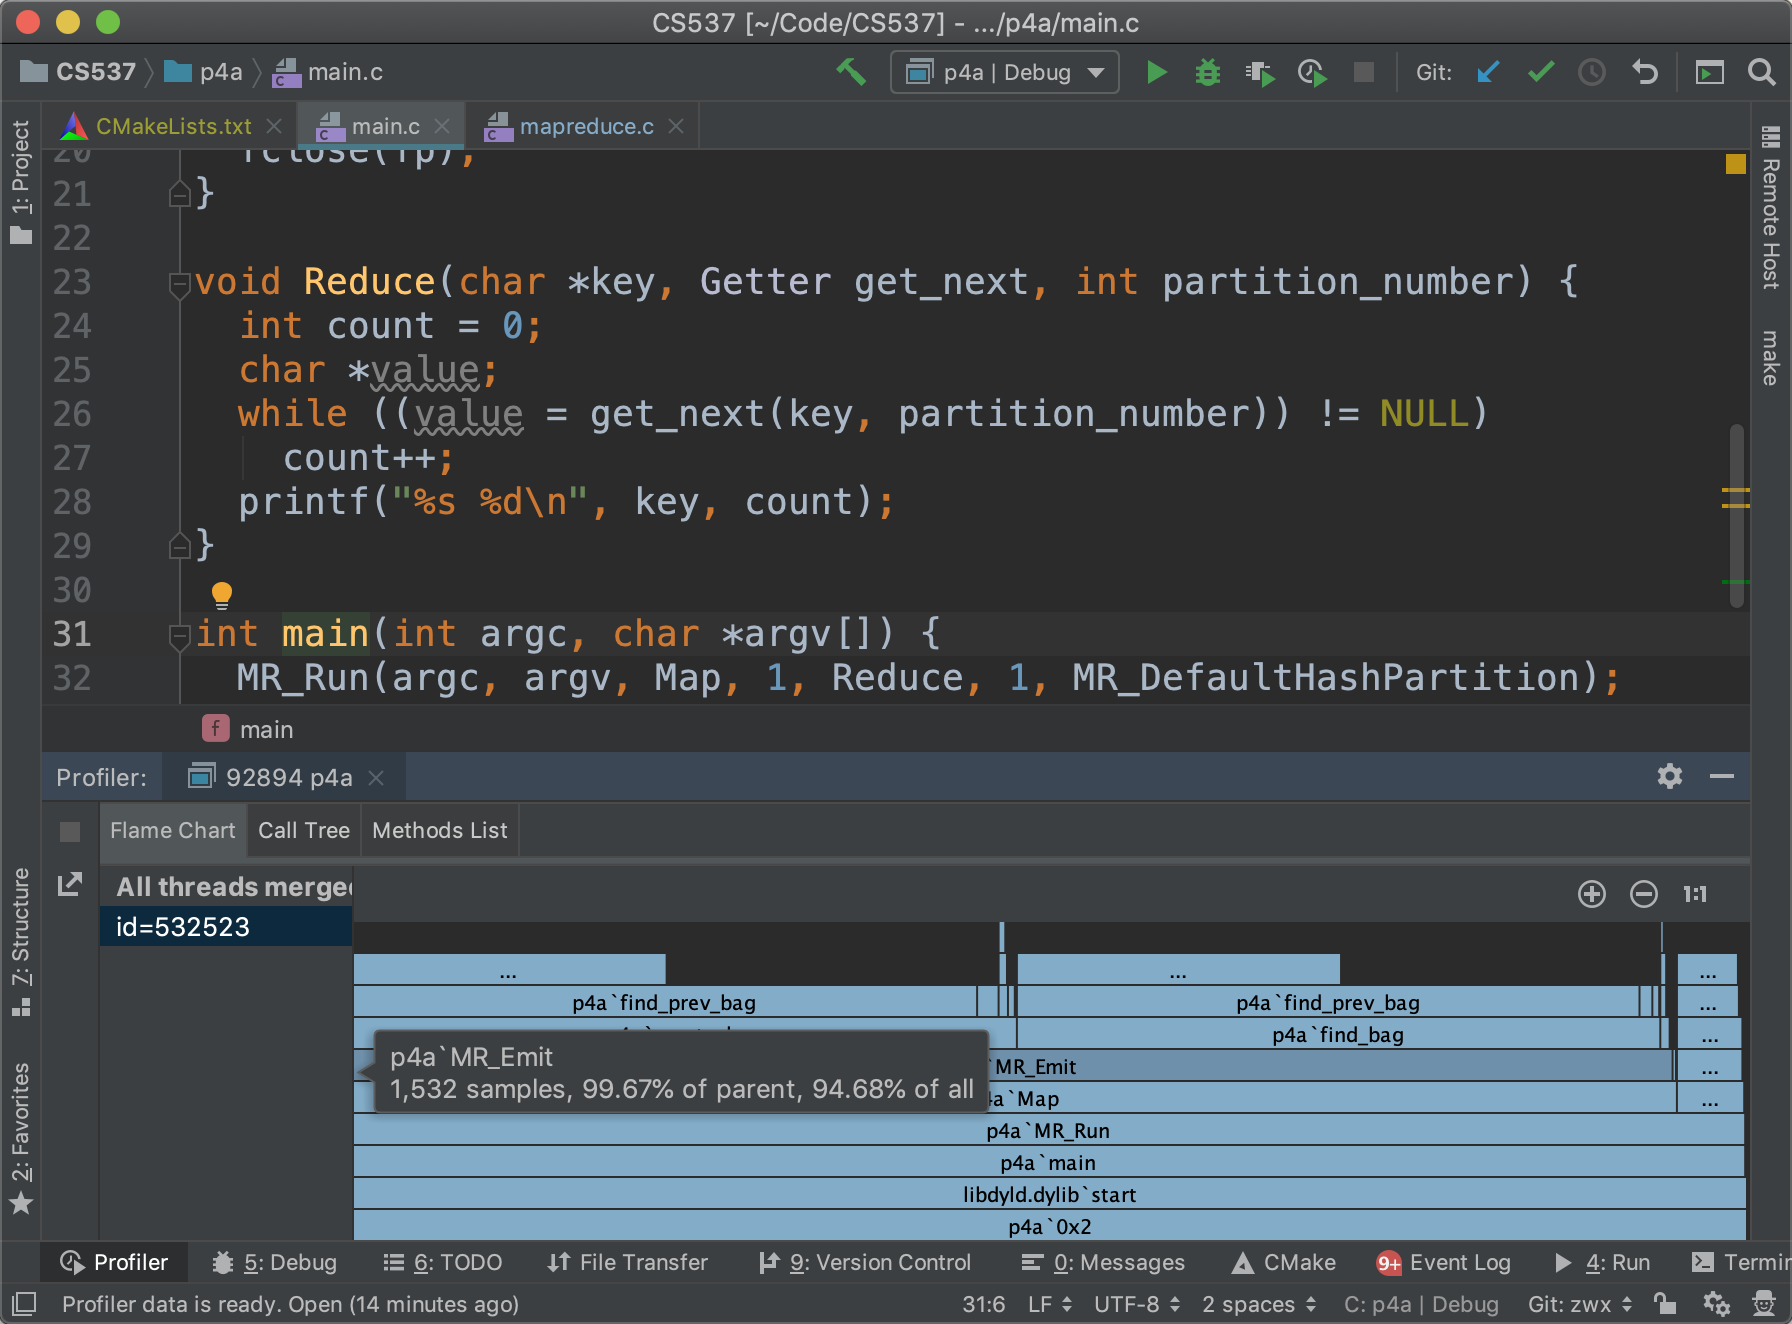
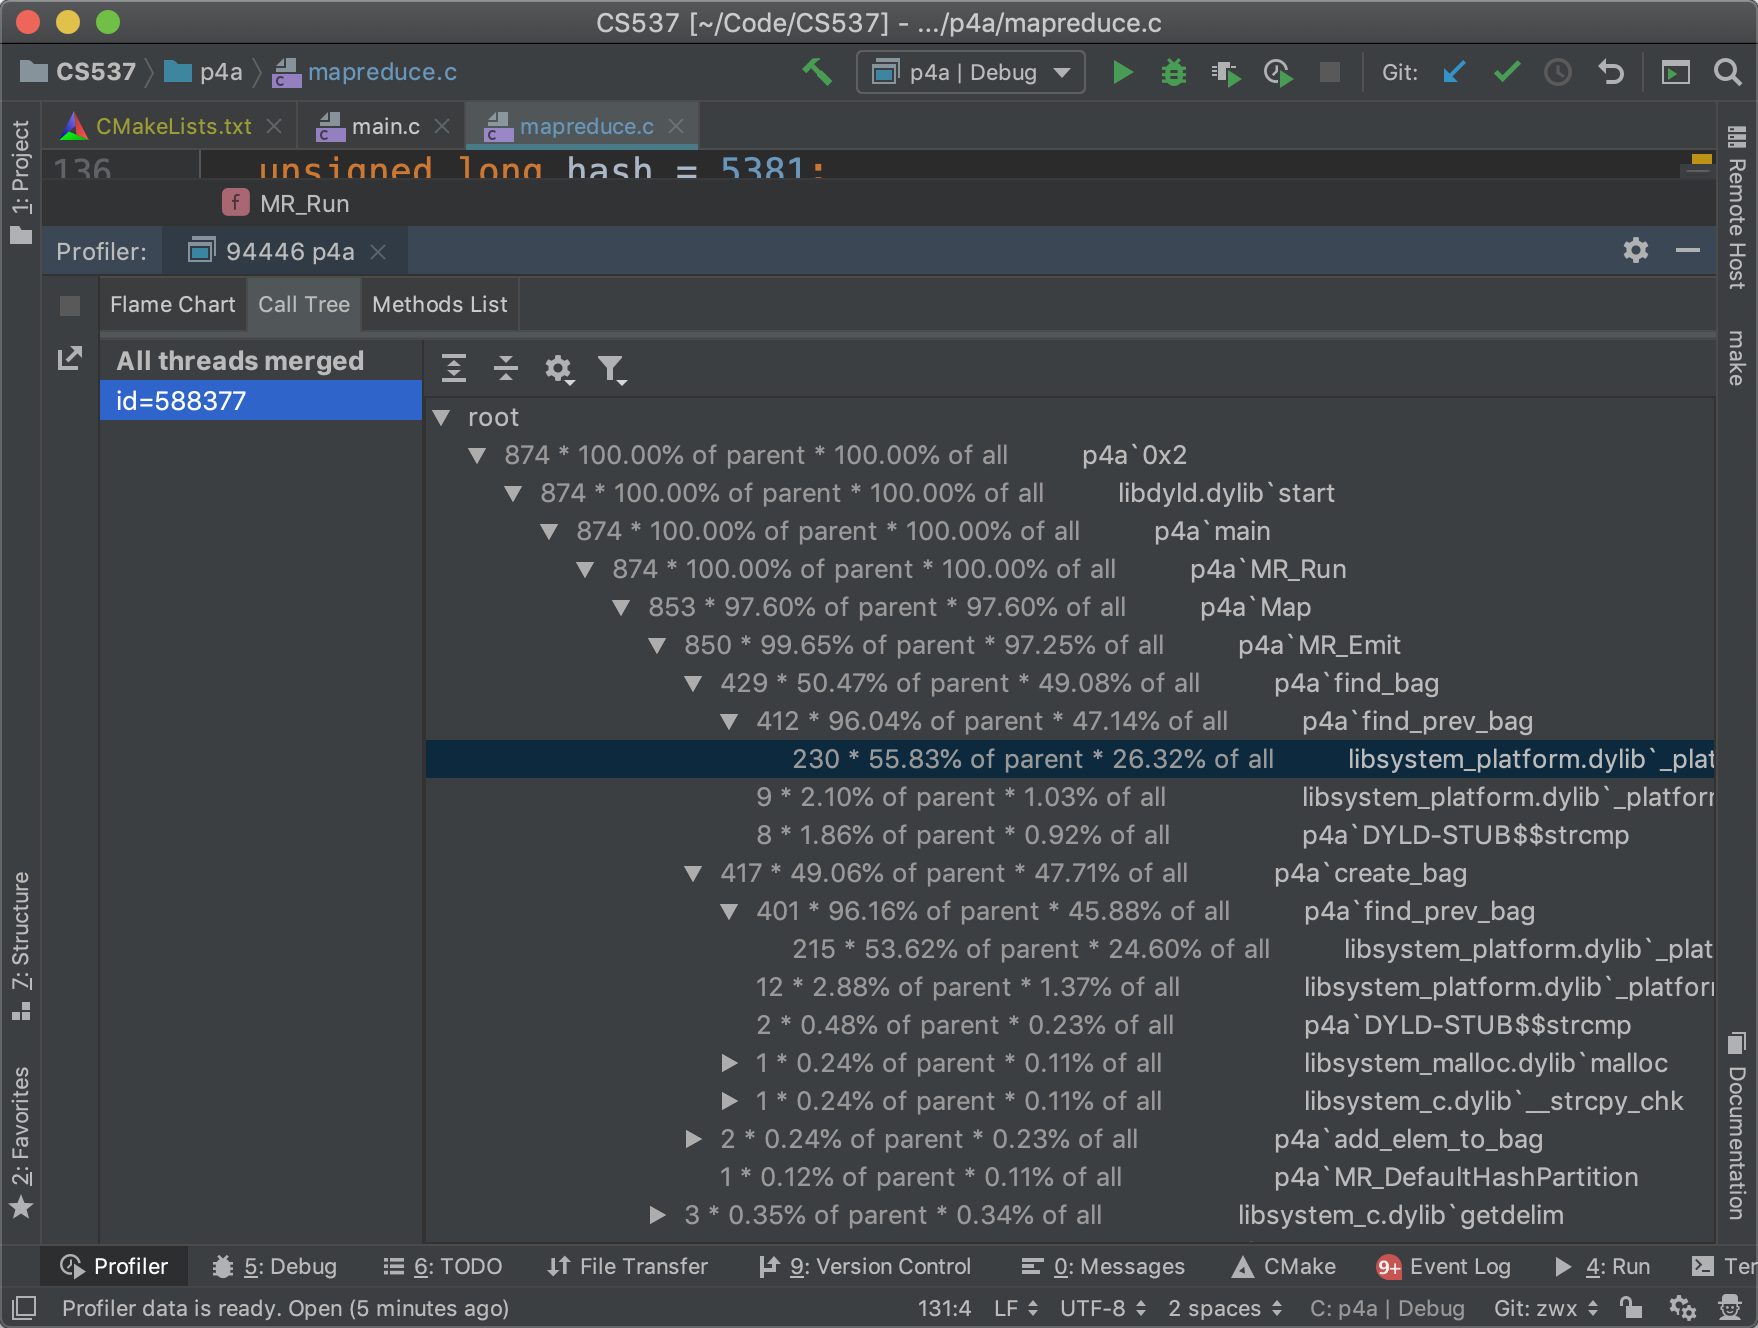
From the screenshot below, you can see that most of the execution time (94.68%) is spent on
MR_Emit, so I can try to spend my time on that function instead of the reduce part, which only takes 4.82% of the execution time.
Note: CPU profiler won't work on Windows. The computer at CS Lab supports profiler (
Perf), but we don't have the permission to run that for some reason.
Preparation
For Mac users, run the following command to install Command Line Tools, which includes llvm (similar to gcc) and lldb (similar to gdb).
xcode-select --install
For Linux users, make sure you have gcc and perf installed. They should be pre-installed for Ubuntu. If not, you should be able to figure it out :)
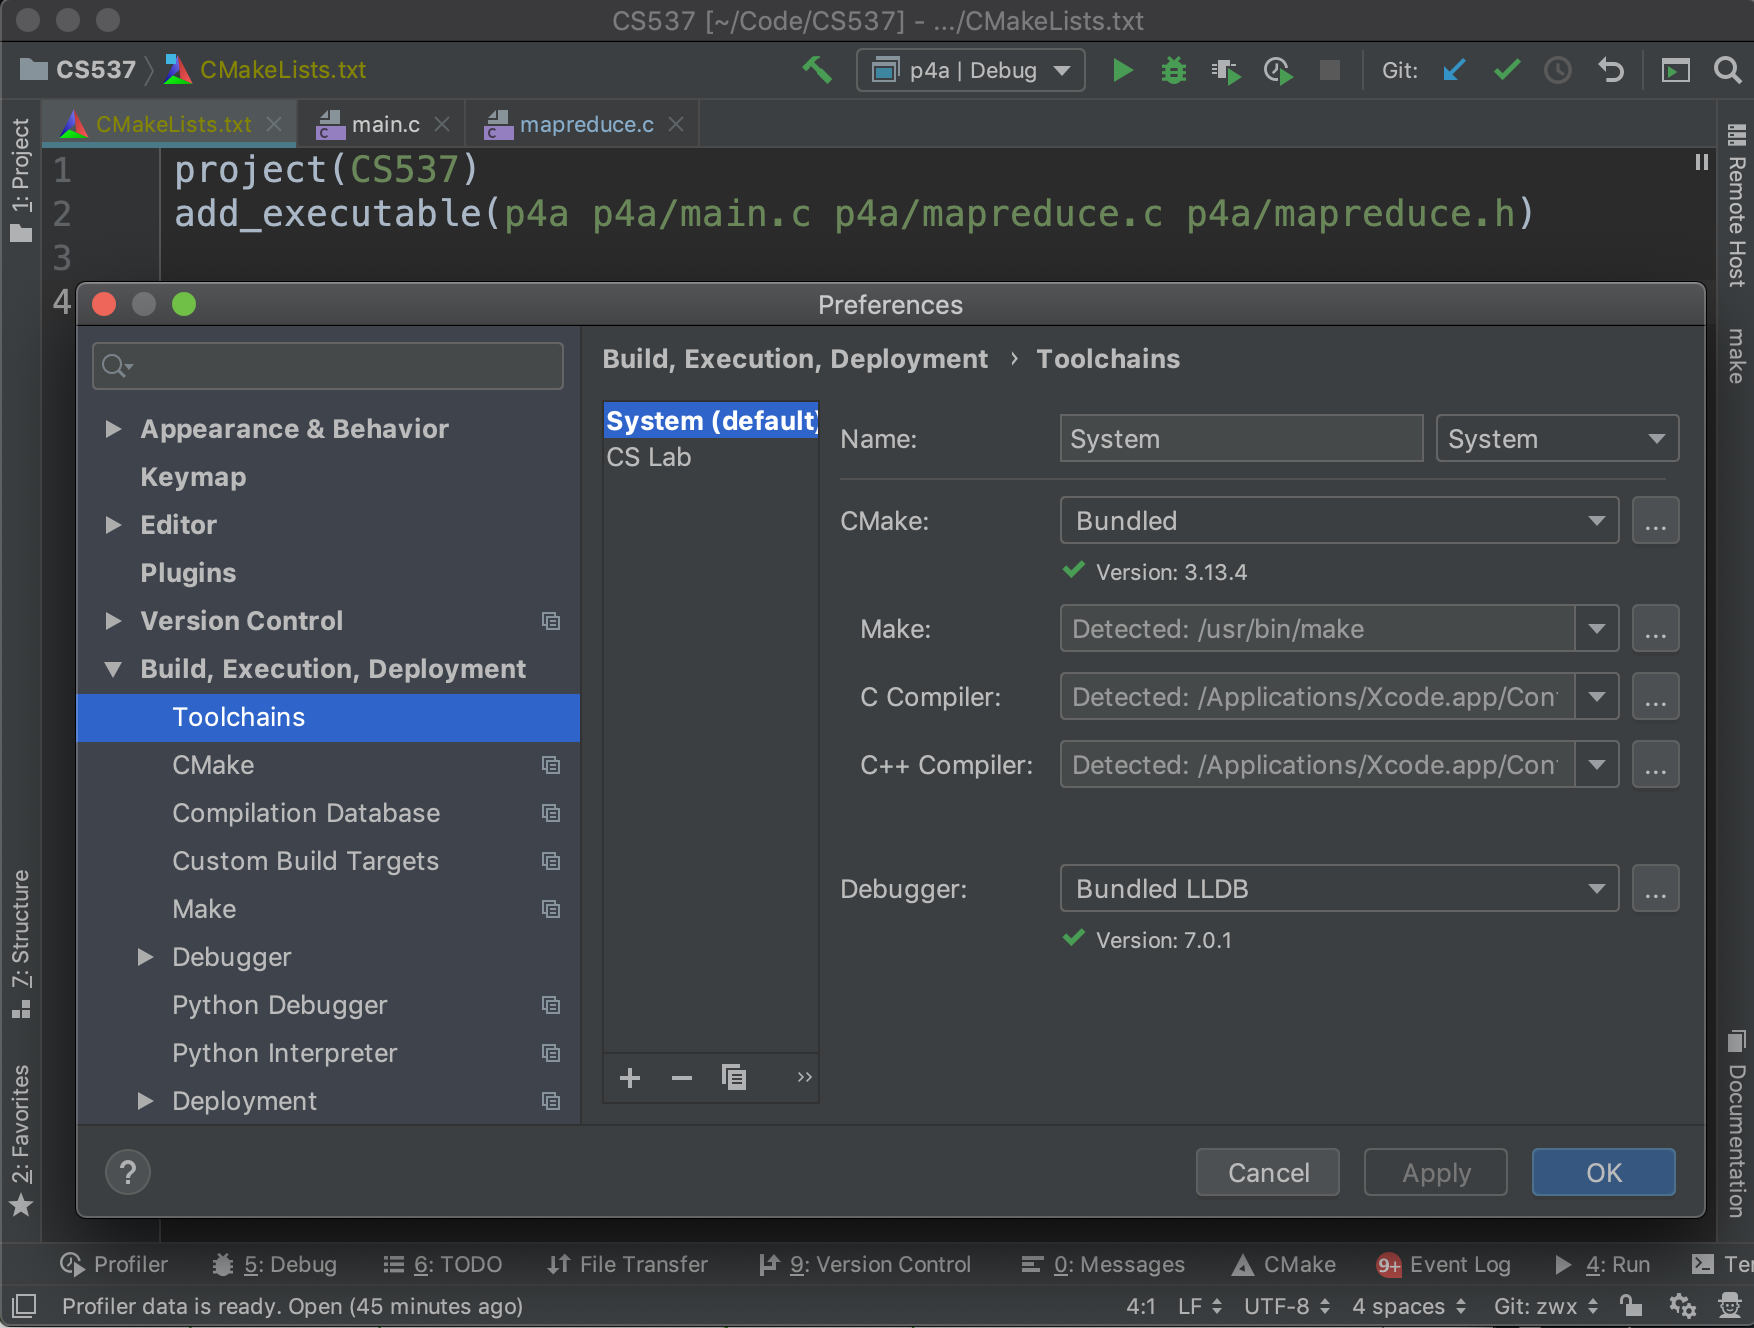
Open CLion and make sure that the run button is clickable with toolchains configured correctly.
Run CPU Profiler
Run the profiler by clicking the run button next to your main function and choose Profile(, or click the button next to stop at the toolbar)
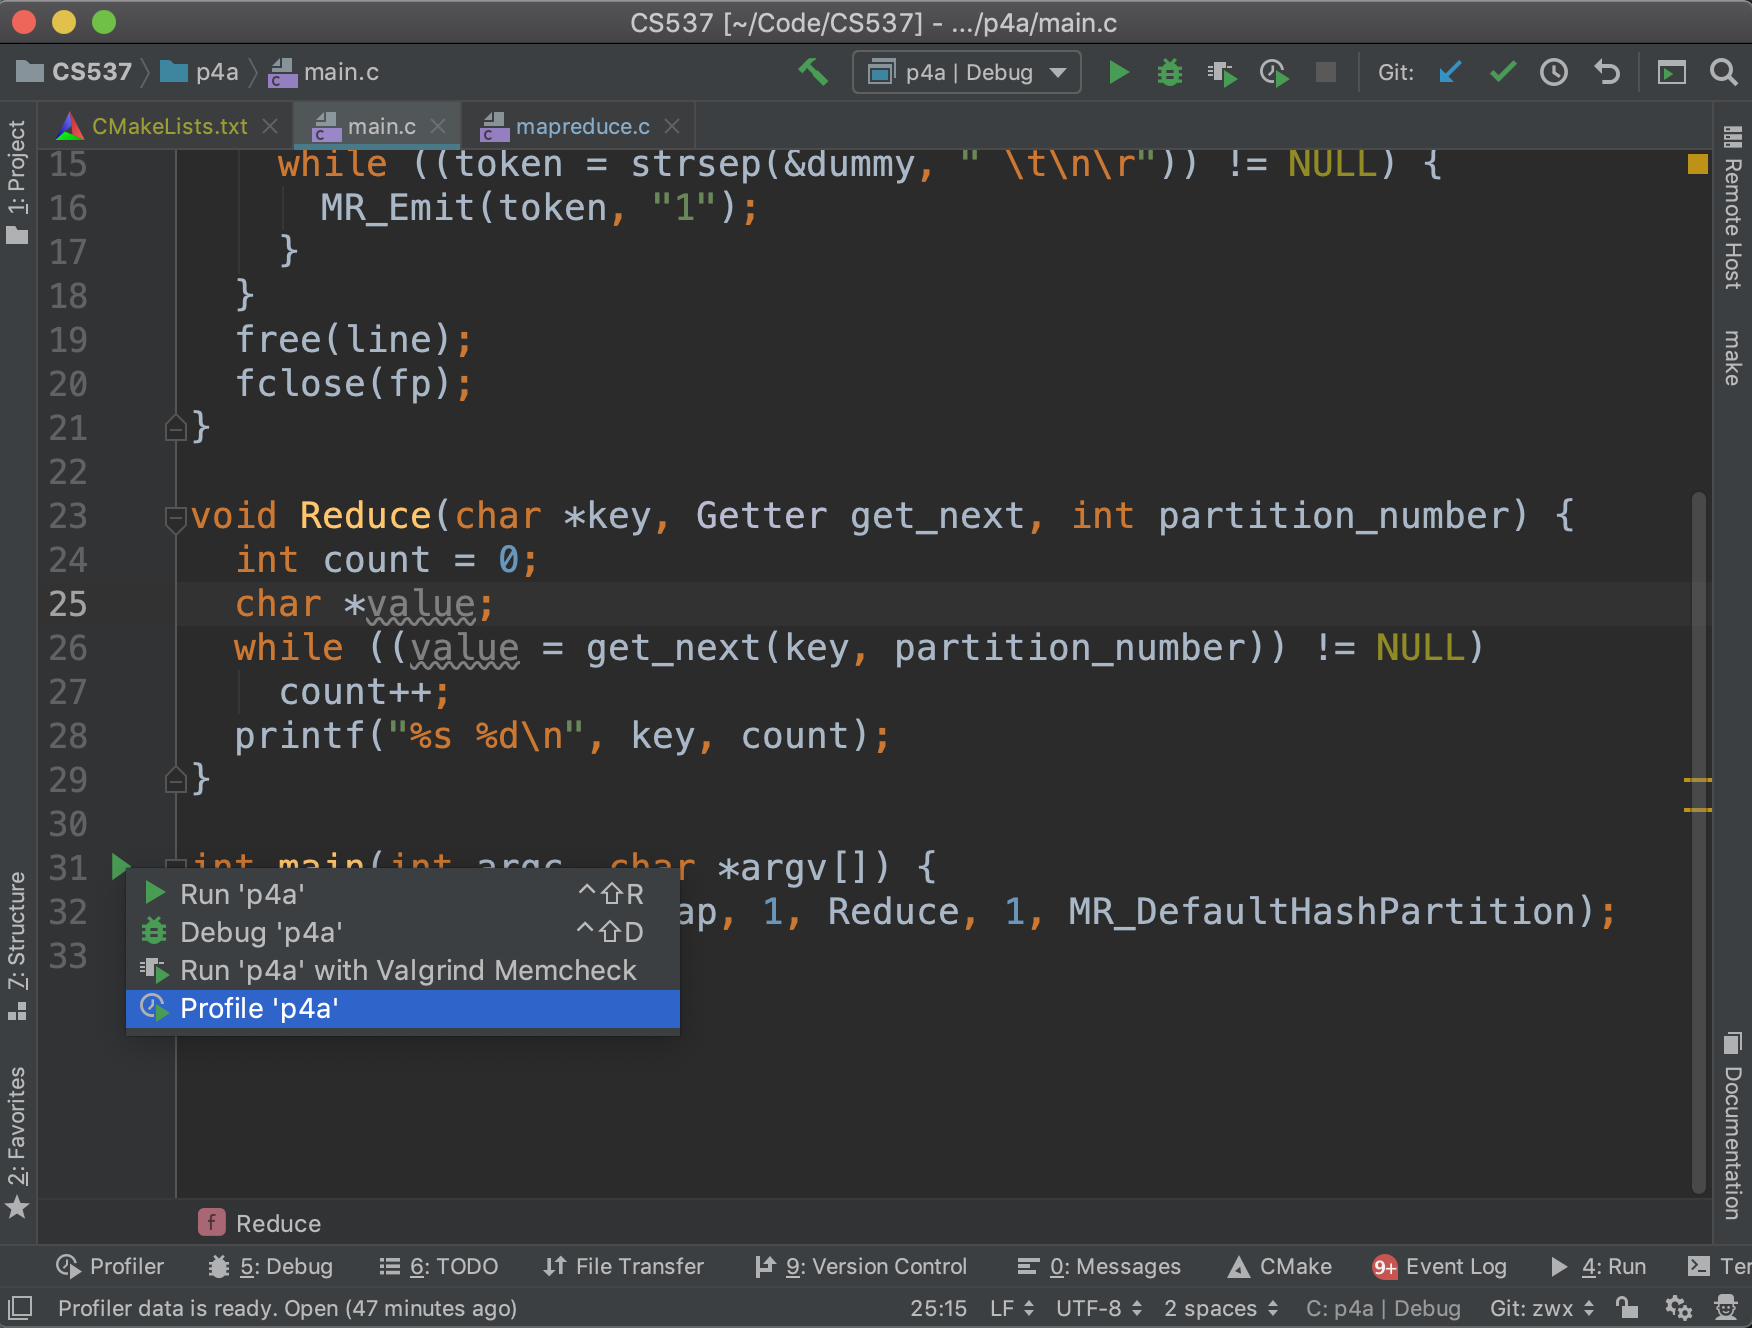
The program will run in profile mode, and a report will be generated by the tool. You can open the report by clicking the Profiler panel on the bottom left corner.
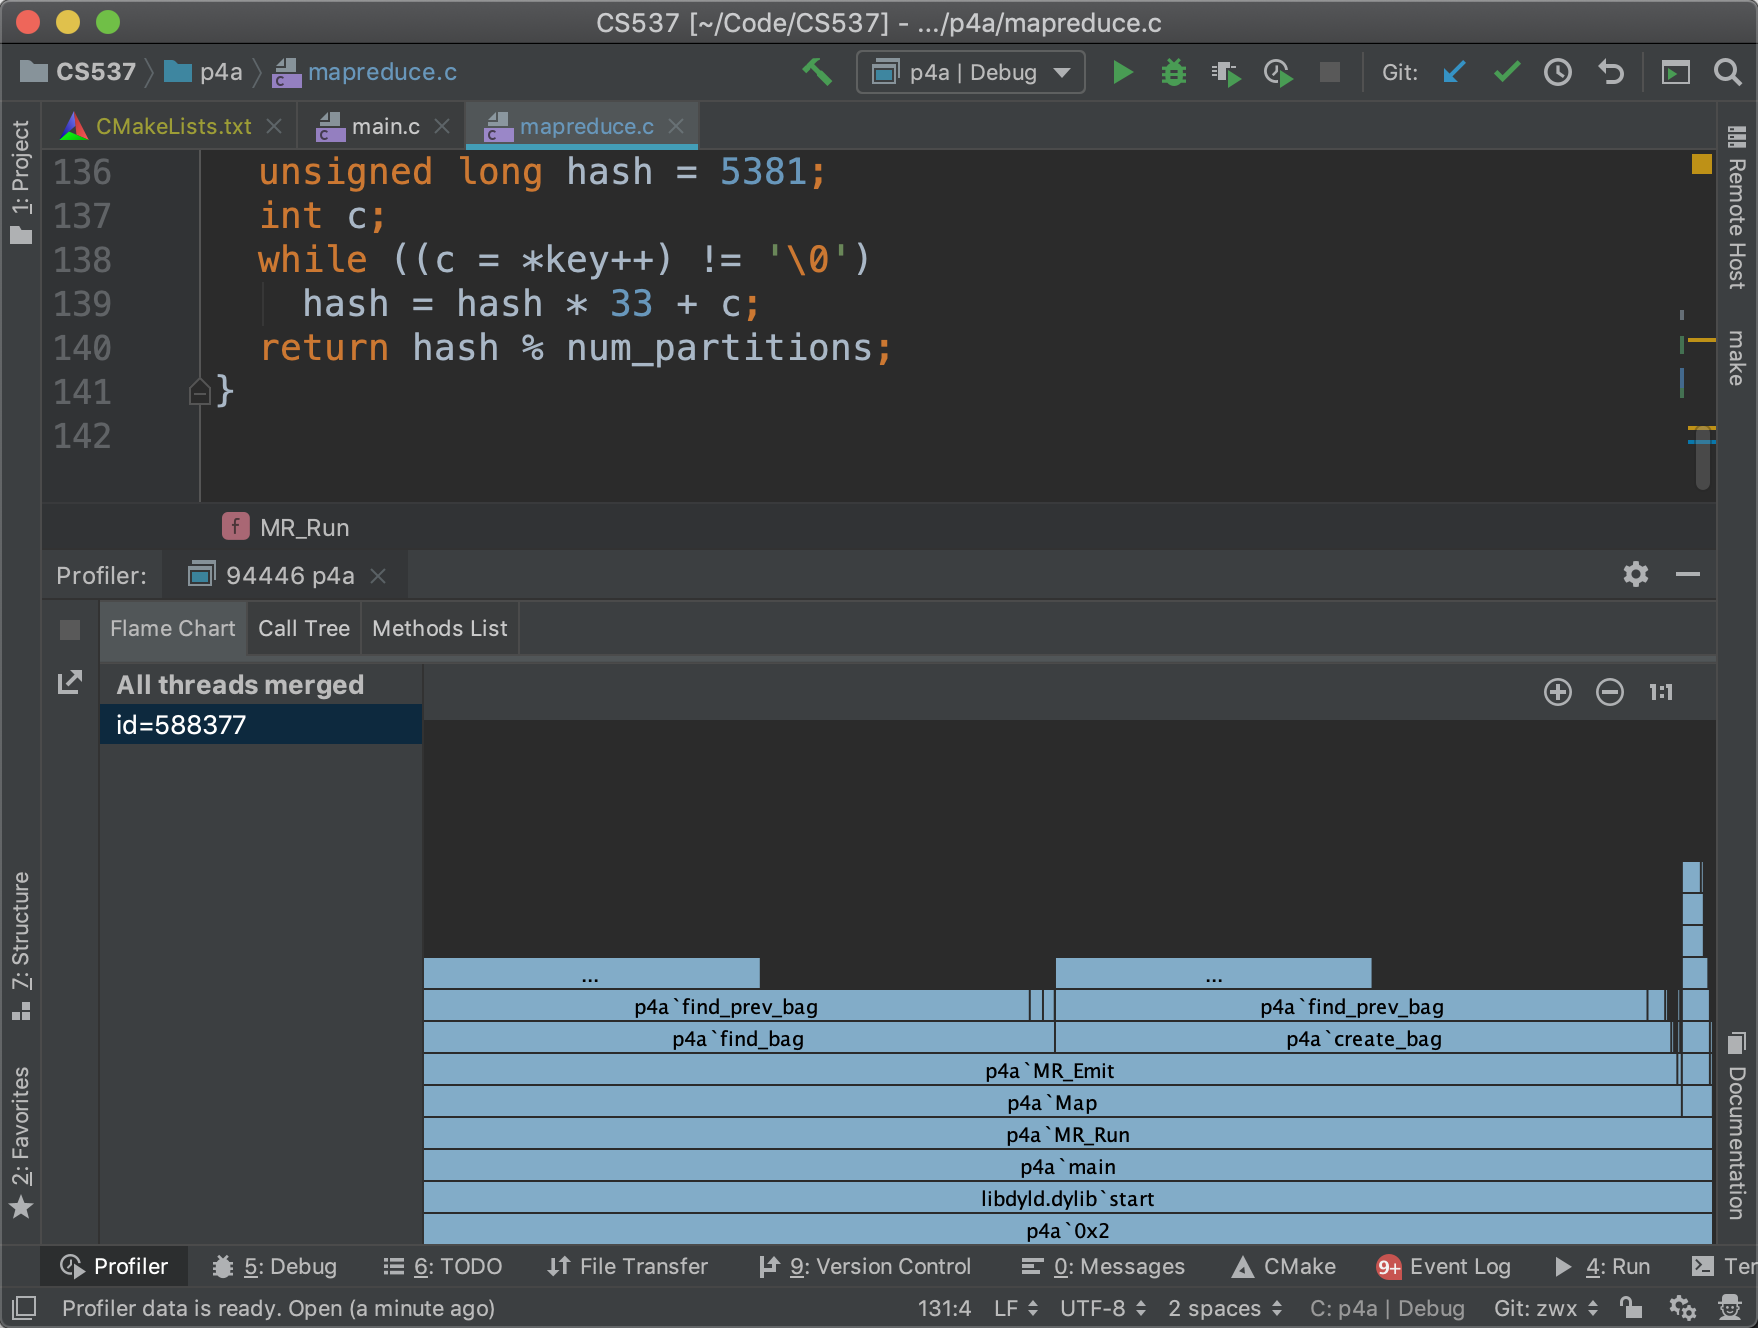
In the Flame Chart tab, you can see a visual representation of the execution time. You can start from the bottom and move up, following the code flow from parent to child functions.
In the Call Tree tab, you can see a tree of function calls with the corresponding execution time.
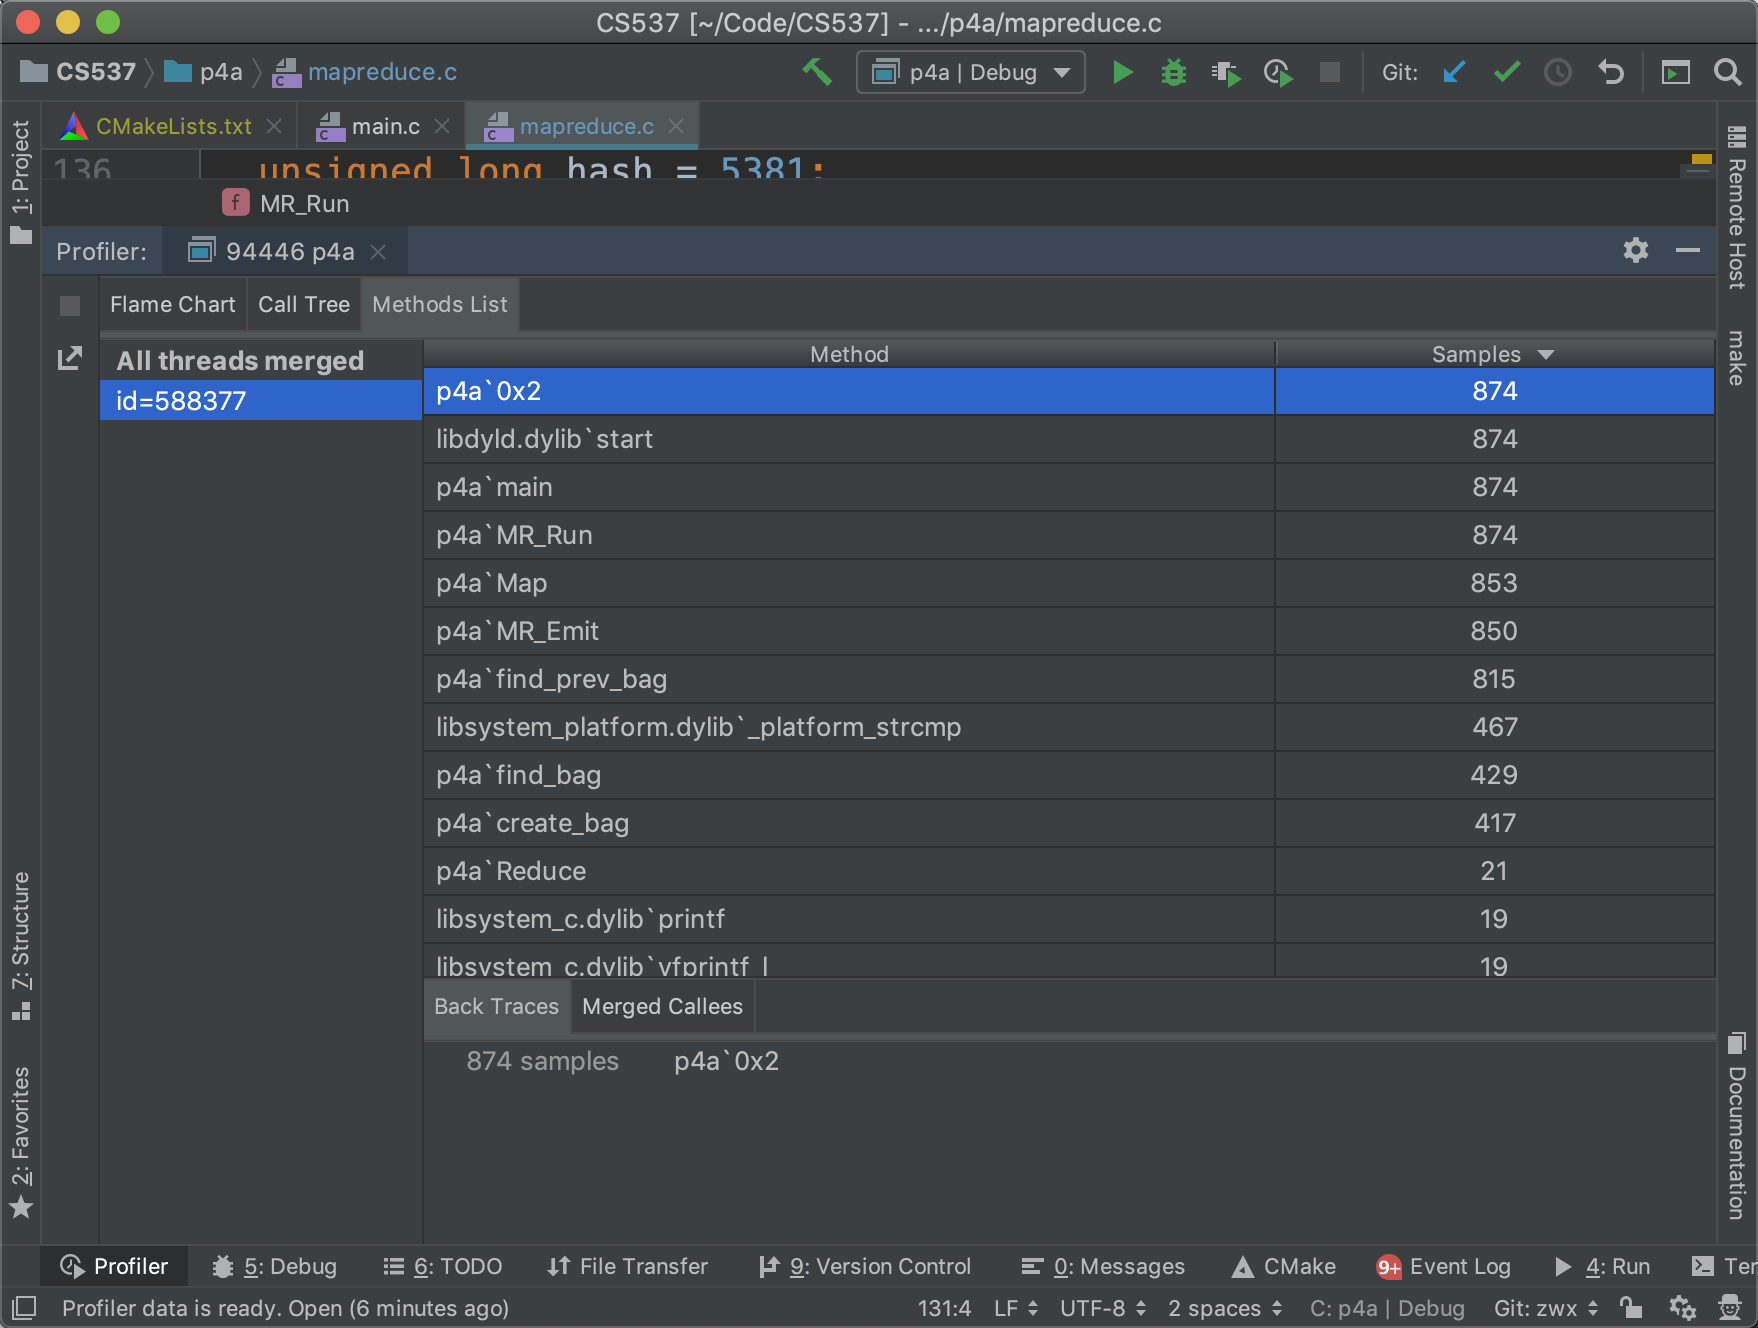
In the Methods List tab, a list of methods is presented ordered by decreasing execution time.
Reference
https://www.jetbrains.com/help/clion/cpu-profiler.html
http://www.brendangregg.com/perf.html
https://perf.wiki.kernel.org/index.php/Main_Page

 Note: This tutorial is specifically focused on Windows users. Some configuration might not work on other operating systems.