This tutorial teaches you how to set up collaborative debugging for xv6 on Windows using VSCode.
If you haven’t installed WSL and/or toolchains for compiling xv6, please refer to my previous tutorial: Compile xv6 Locally on Windows. Also, make sure that you have gdb installed on Windows (not just in WSL).
Note: This tutorial is specifically focused on Windows users. Some configuration might not work on other operating systems.
Configure Build Task
To simplify the workflow, we can set up a task in VSCode for building xv6.
First, open the folder for xv6 in VSCode and open “Terminal > Configure Tasks…” in the menu.
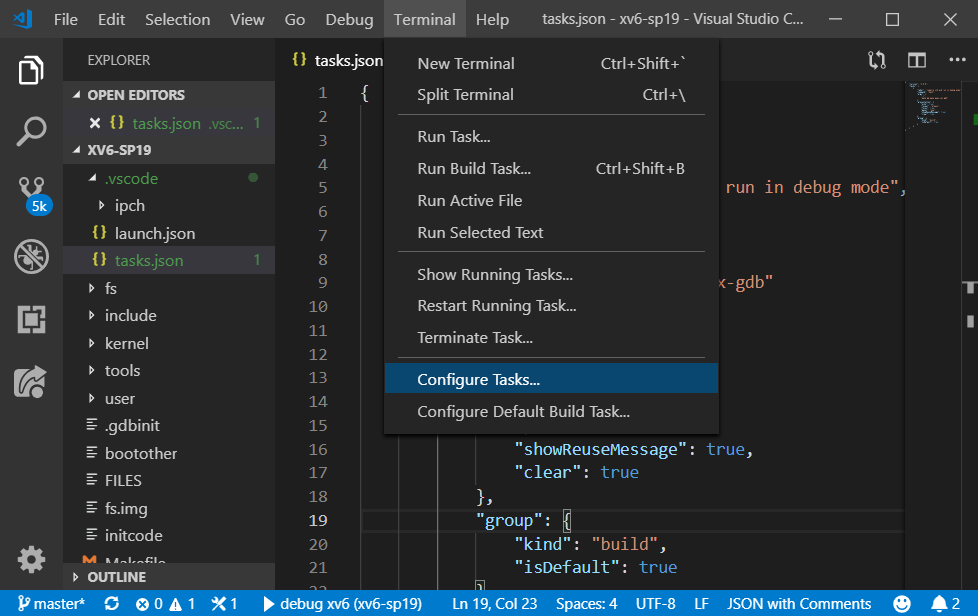
On the popup window, choose “Create tasks.json file from template” and copy the following content to tasks.json. (Equivalently, you can directly create tasks.json under ./vscode folder and past the lines below)
{
    "version": "2.0.0",
    "tasks": [
        {
            "label": "compile xv6 and run in debug mode",
            "command": "bash",
            "args": [
                "-c",
                "make && make qemu-nox-gdb"
            ],
            "presentation": {
                "echo": true,
                "reveal": "always",
                "focus": true,
                "panel": "new",
                "showReuseMessage": true,
                "clear": true
            },
            "group": {
                "kind": "build",
                "isDefault": true
            }
        }
    ]
}
make && make qemu-nox-gdb is executed in the bash of Linux subsystem.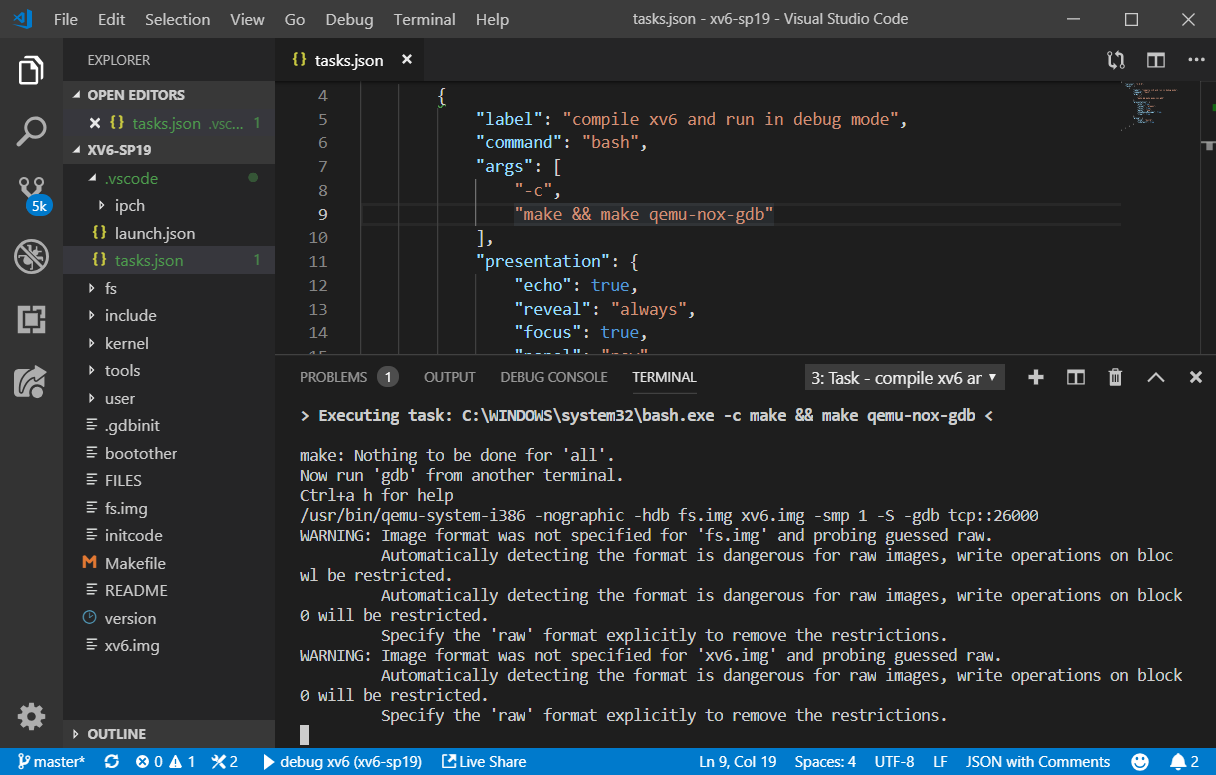
Add Debug Configuration
To enable remote debugging, you need to install a plugin called Native Debug. You can install it in the Extensions tab on the left (or press Ctrl+P and run ext install webfreak.debug)

After Native Debug is installed, open “Debug > Open Configurations” in the menu. and past the following lines to launch.json. (Or equivalently, create launch.json under ./vscode folder and past the lines below)
{
    "version": "0.2.0",
    "configurations": [
        {
            "type": "gdb",
            "request": "attach",
            "name": "debug xv6",
            "executable": "kernel/kernel",
            "target": ":26000",
            "remote": true,
            "cwd": "${workspaceRoot}",
        }
    ]
}
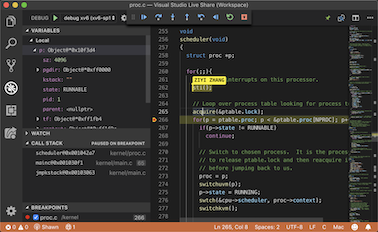
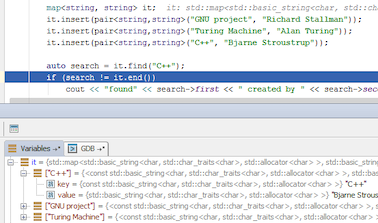
To test whether debugging is configured correctly, add a breakpoint at kernel/proc.c:266 by clicking the space left to the line number and press F5 for debugging (or open “Debug > Start Debugging” in the menu). You should be able to see the program stops at the specified line with variables and call stack shown at the left.
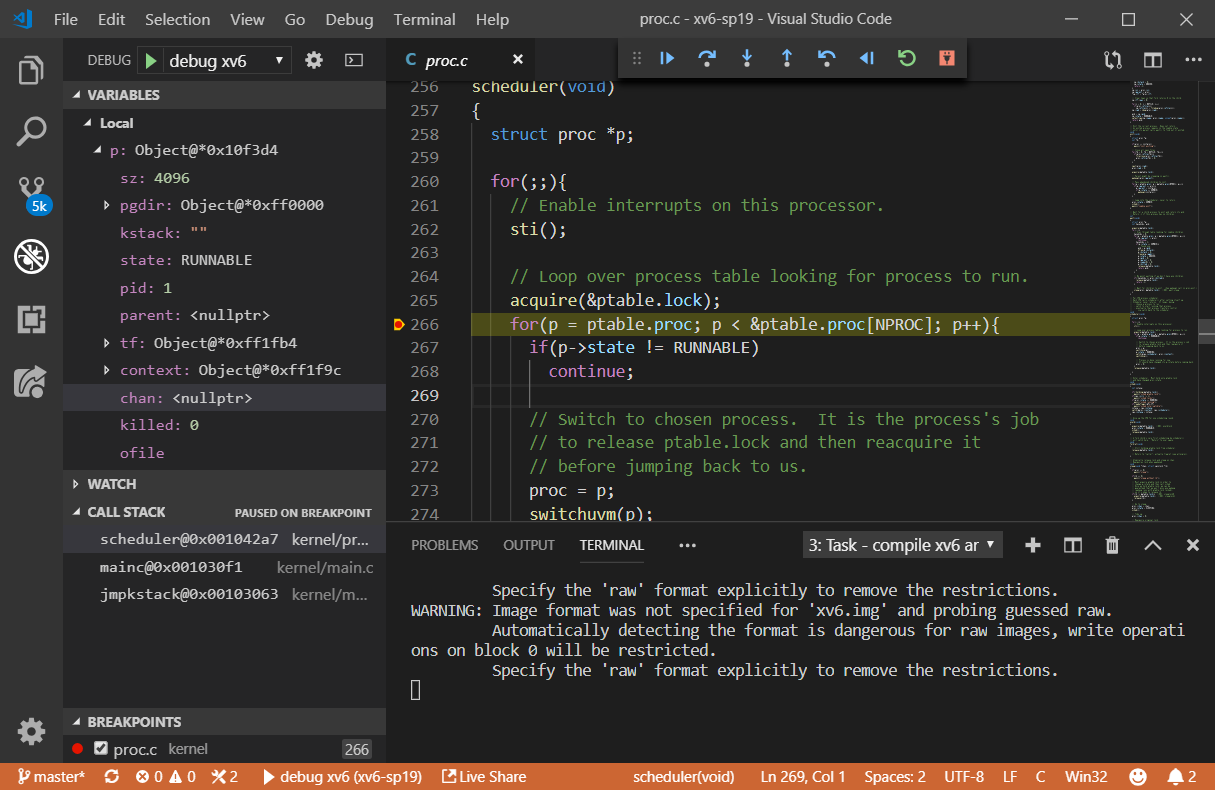
Congratulations! You just set up the debugger for xv6!
Be familiar with the first 4 icons in the floating toolbar. They are Continue/Resume, Step Over, Step Into, and Step Out respectively.
![]()
You can also watch a variable in the WATCH panel, such as ptable->proc[0]->name. To set a conditional breakpoint, open “Debug > New Breakpoint > Conditional Breakpoint” in the menu.

Collaborative Debugging
If you haven’t heard about VSCode Live Share or haven’t installed it, you can check my previous tutorial: Pair Programming using VSCode.
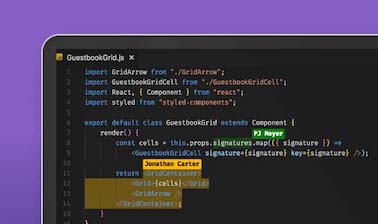
Click the live share button on the bottom of VSCode, and share the invitation like to your partner. Your partner can join the debug session and control the debugging process by clicking the button on the toolbar.
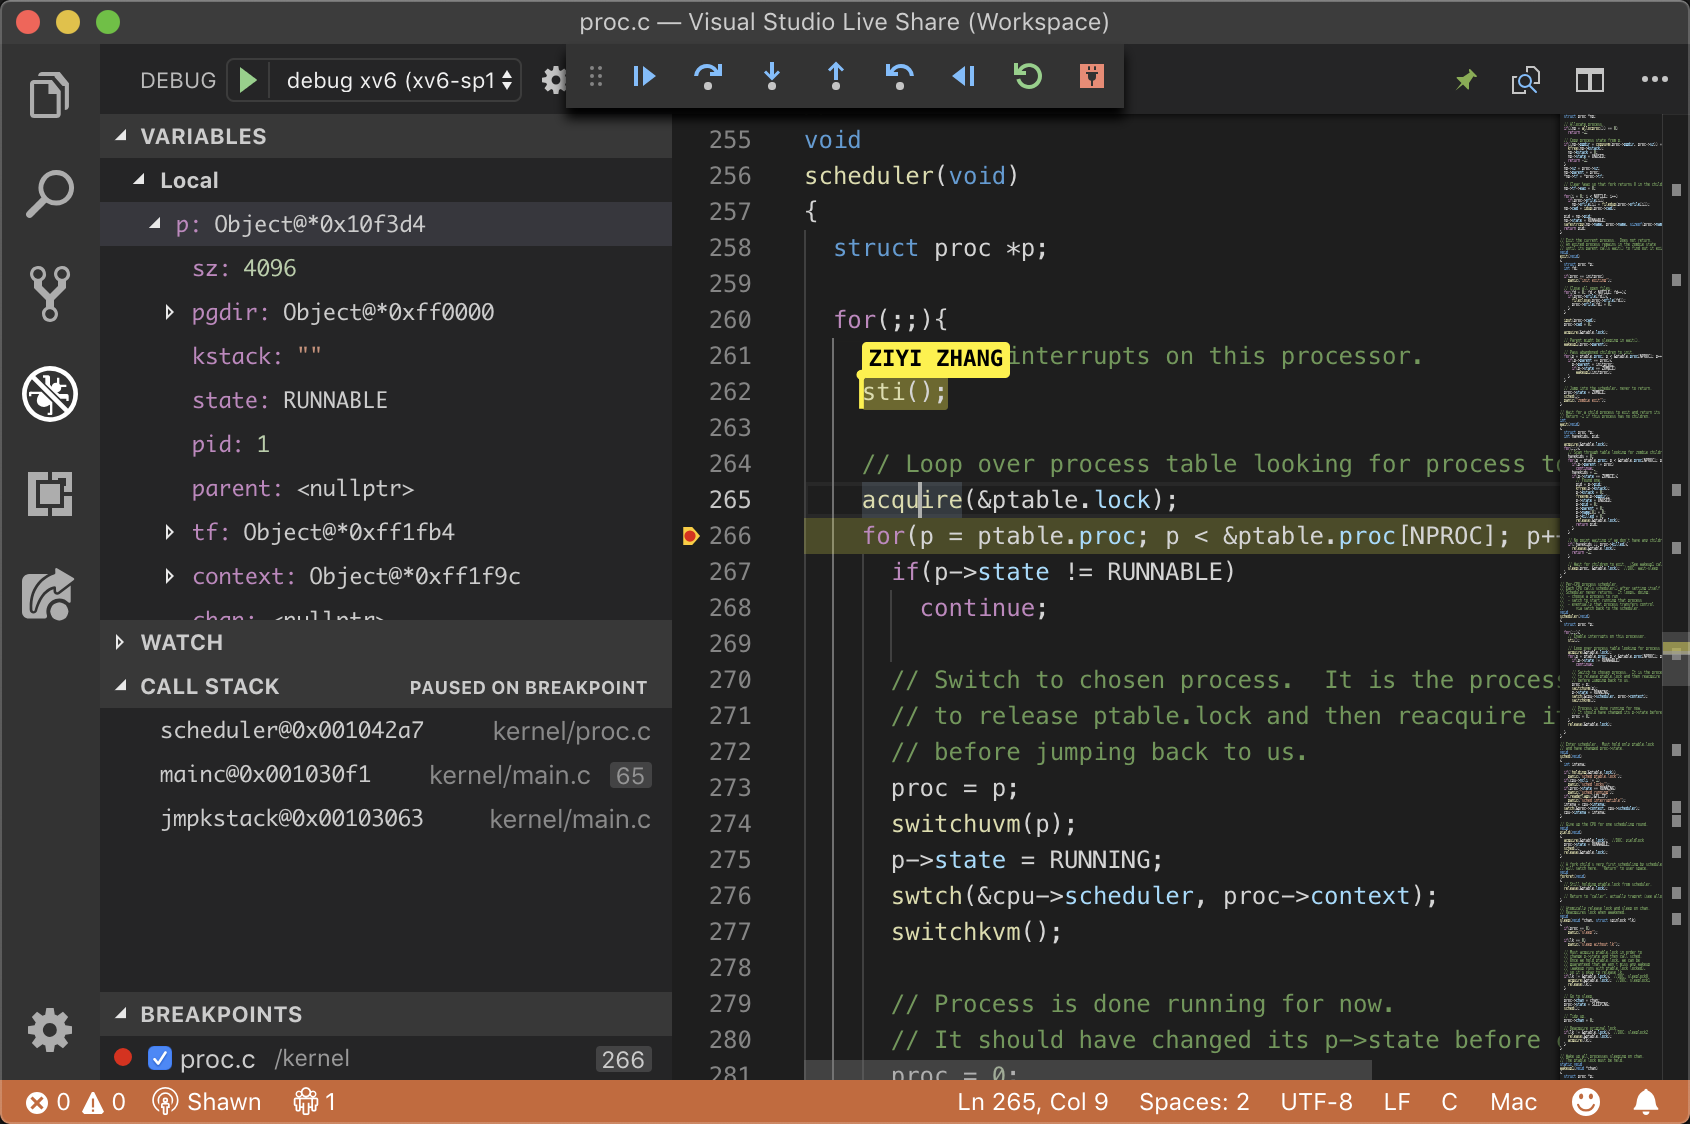
Note that the screenshot below is on macOS. The variables, call stack, and breakpoints are all synced to this computer.

References
https://docs.microsoft.com/en-us/visualstudio/liveshare/use/vscode

Has one comment to “Co-debug xv6 on Windows using VSCode”
You can leave a reply or Trackback this post.